|
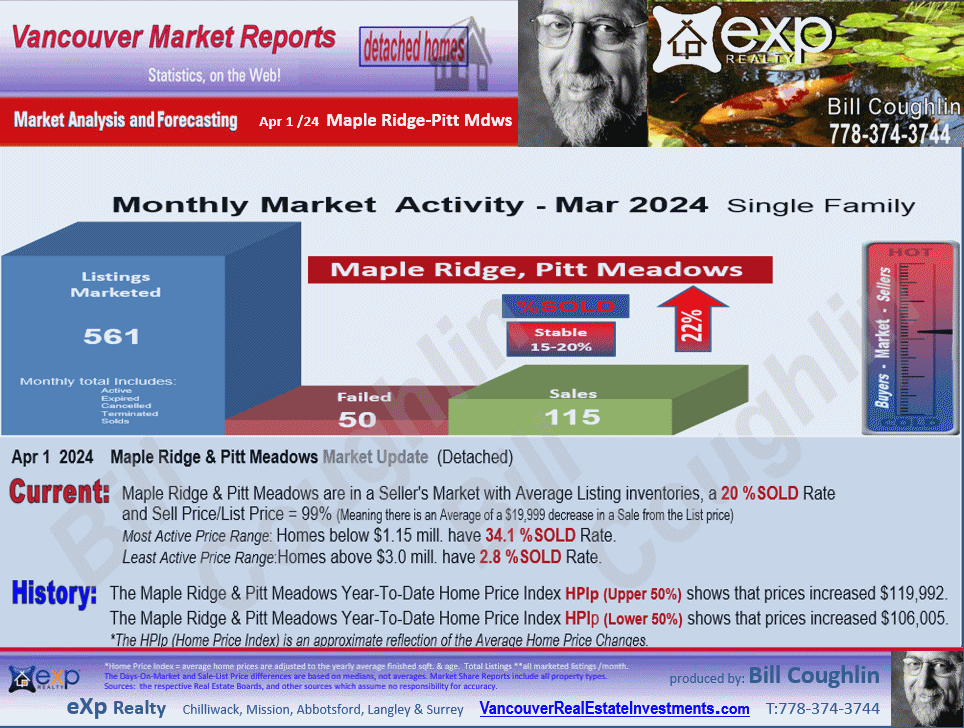
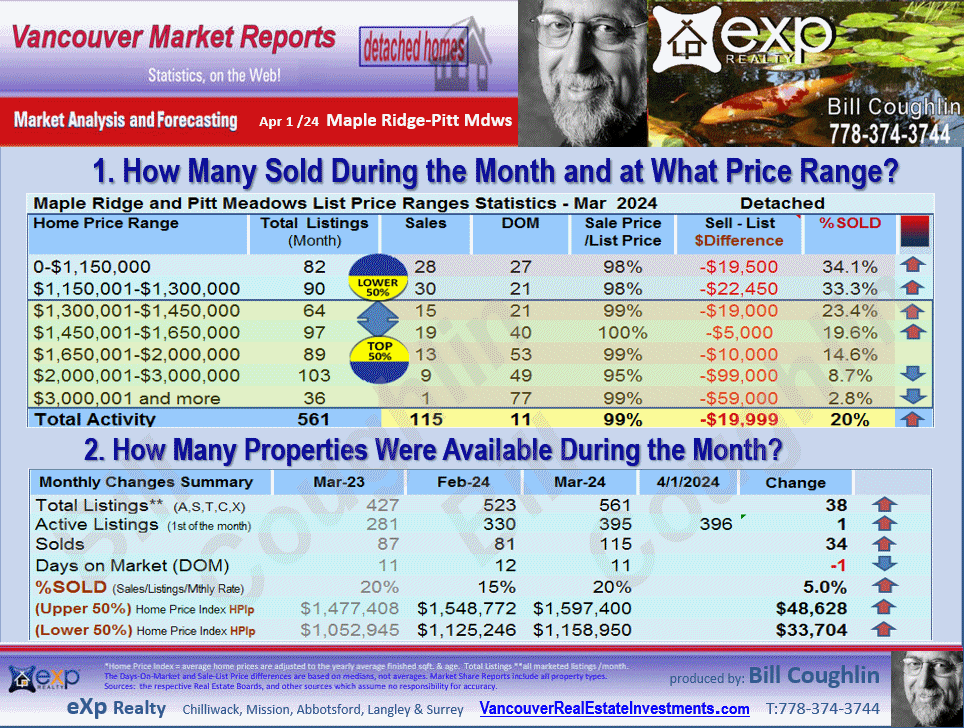
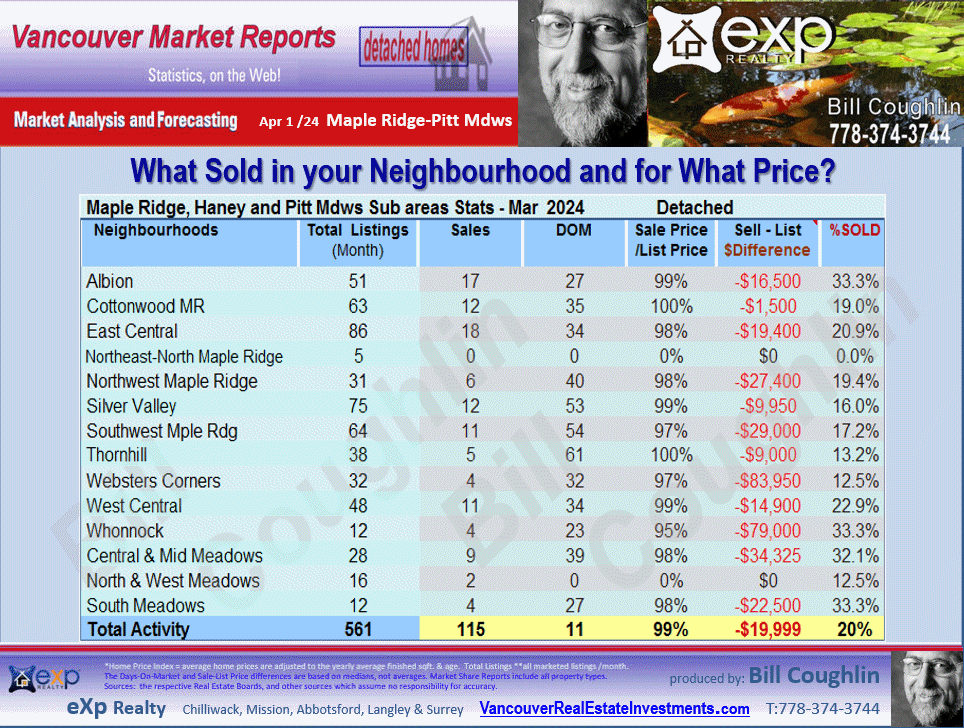
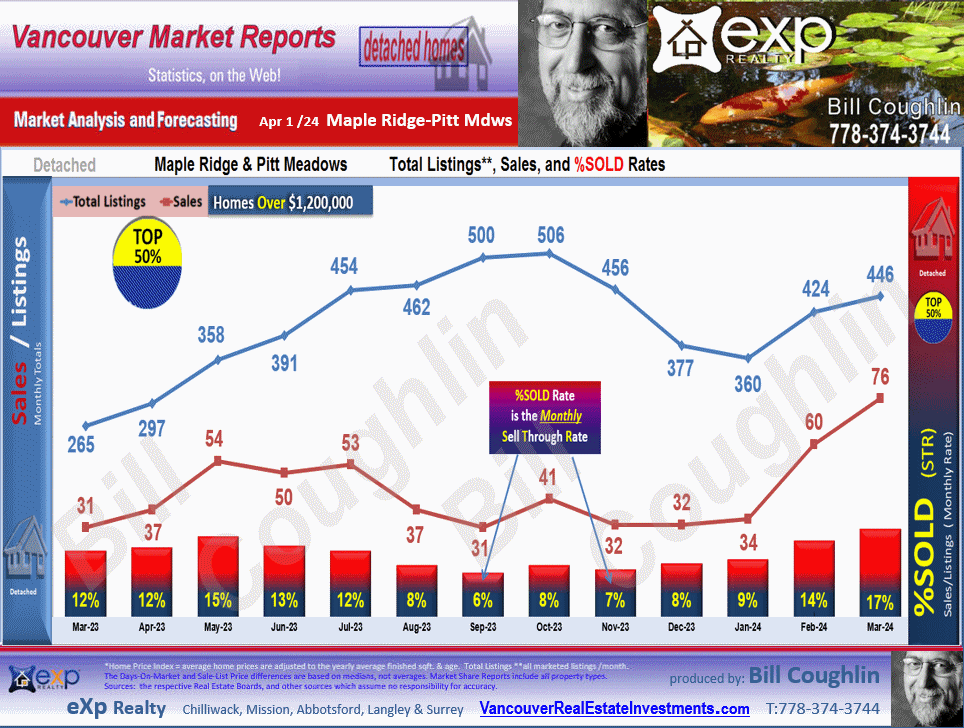
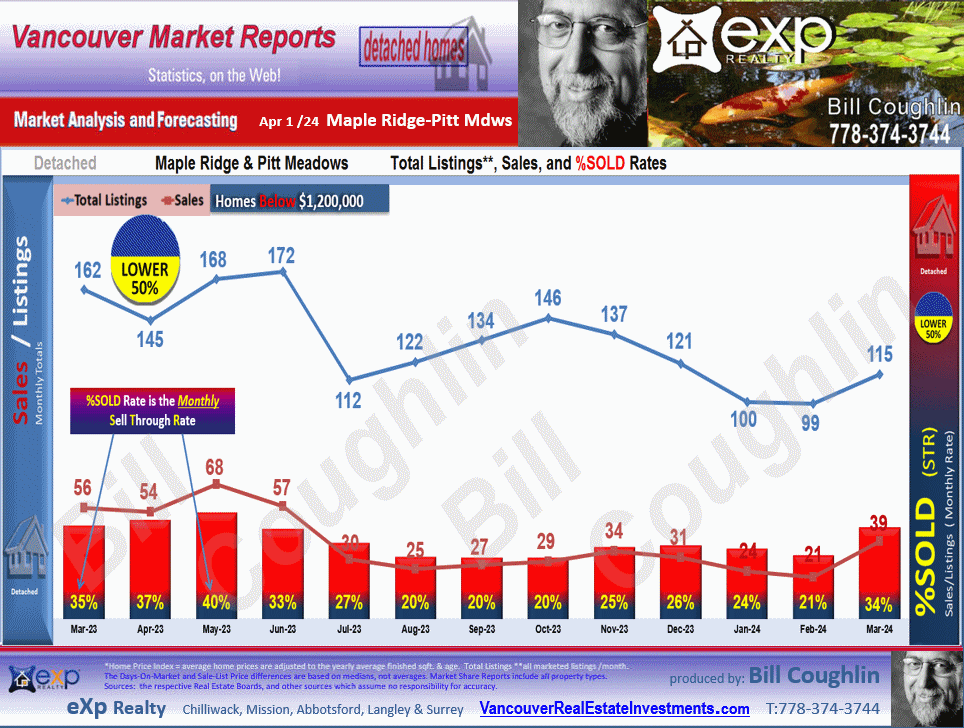
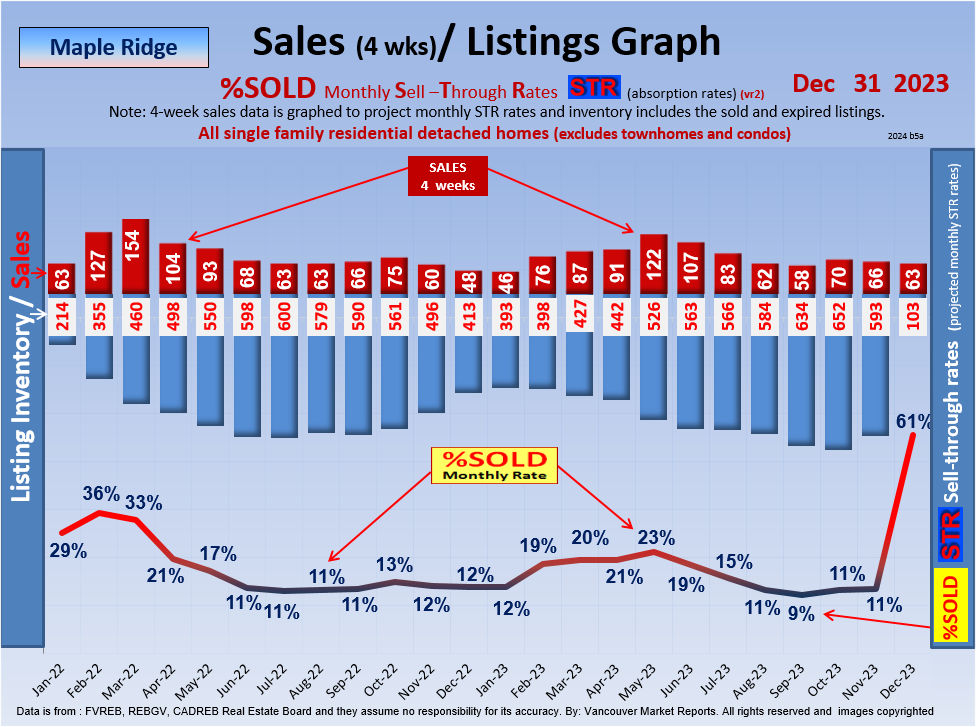
Current: Maple Ridge & Pitt Meadows are in a Seller's Market with Average Listing inventories, a 20 %SOLD Rate and Sell Price/List Price = 99%
(Meaning there is an Average of a $19,999 decrease in a Sale from the List price)
Most Active Range: Homes below $1.3 mill.-$1.45 mill. have 34.1 % SOLD Rate
Least Active Range: Homes above $3.0 mill. have 2.8 %SOLD Rate.
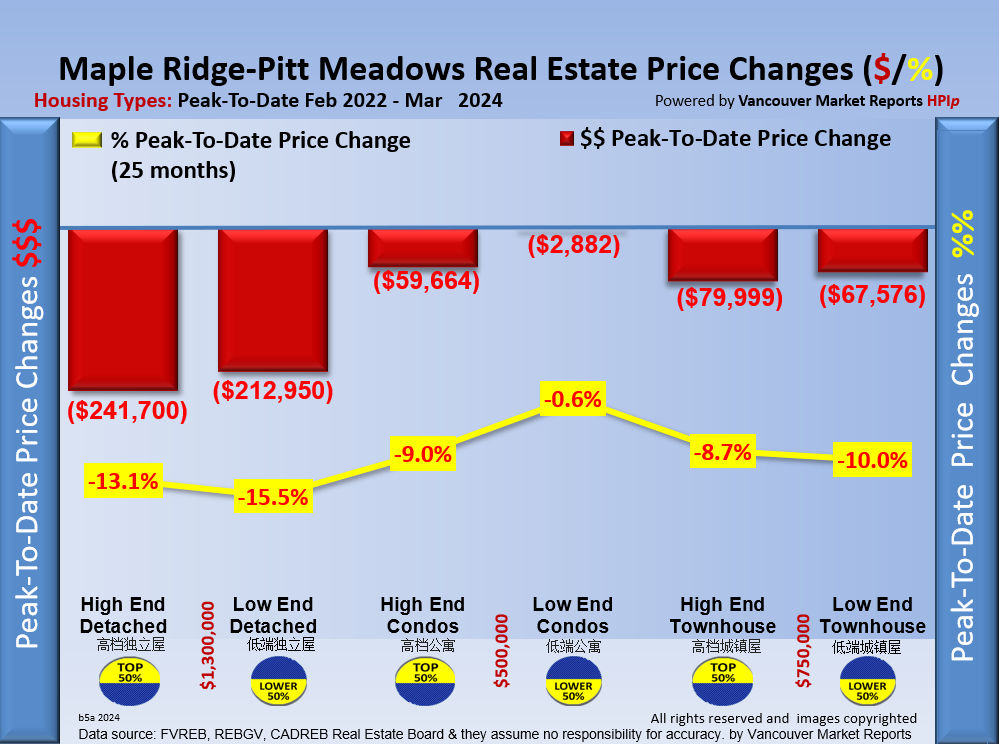
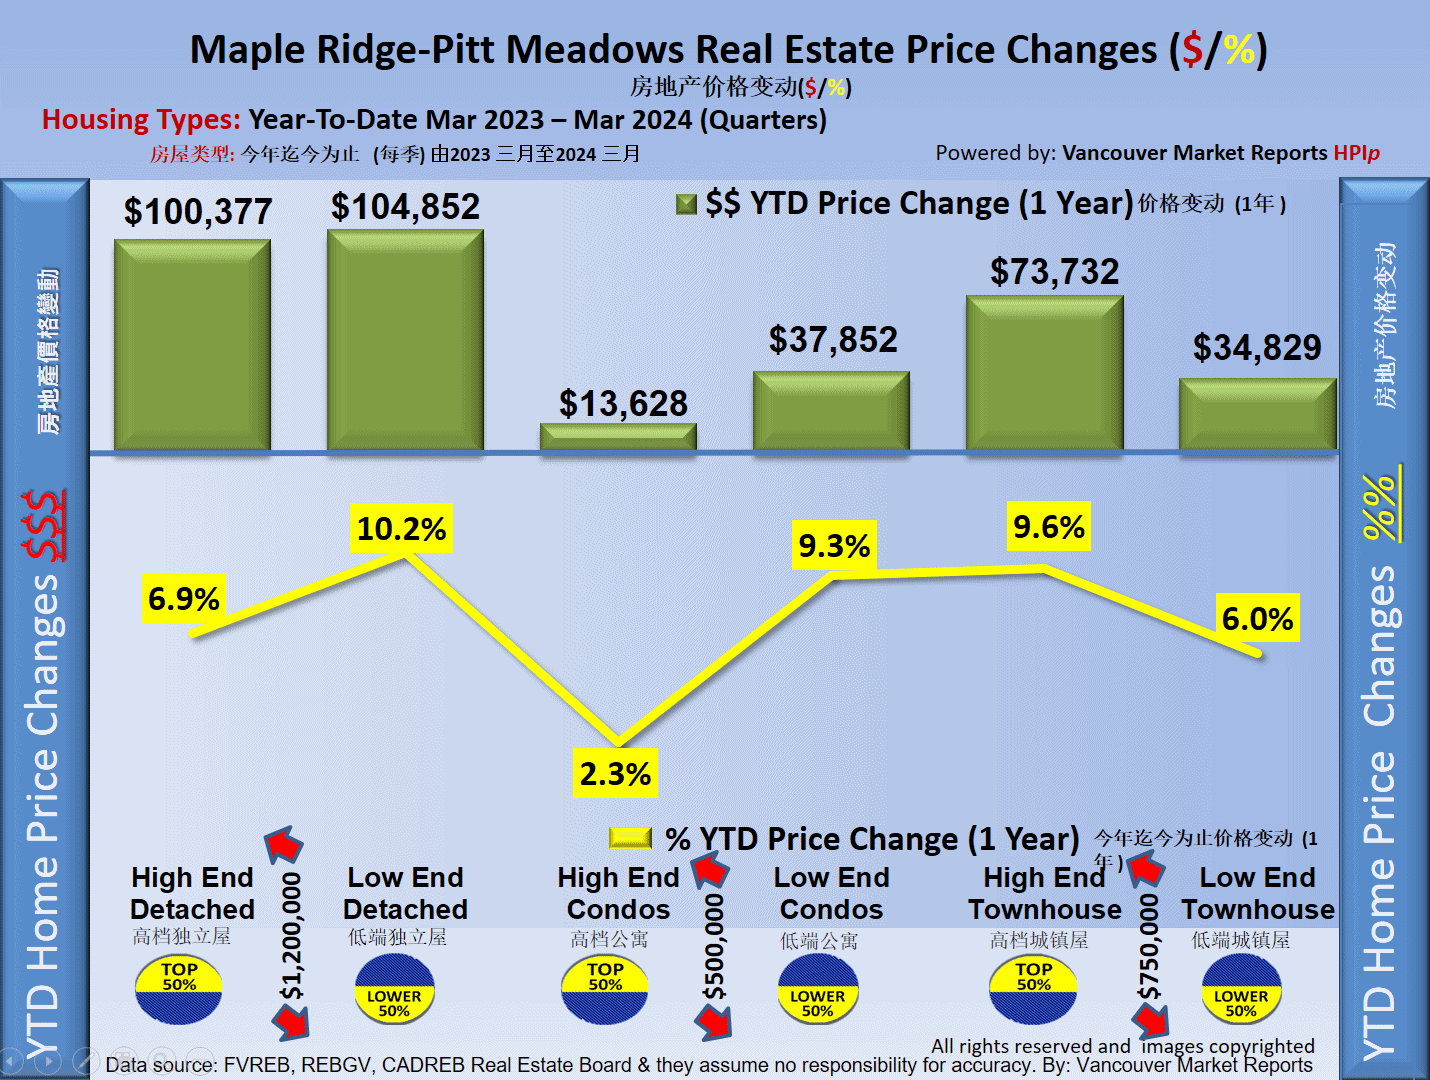
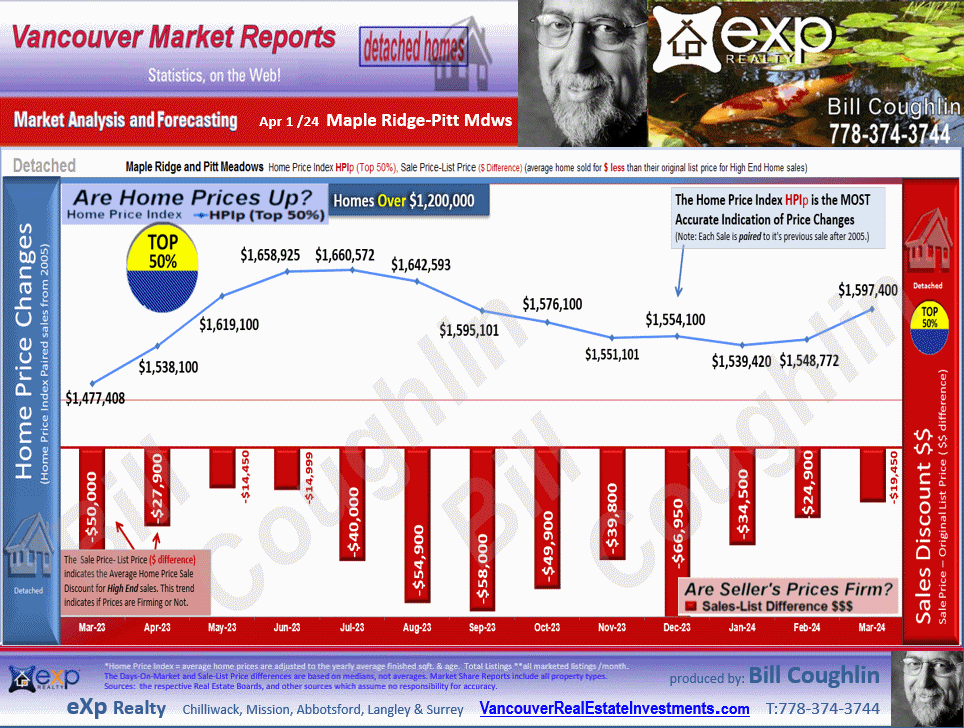
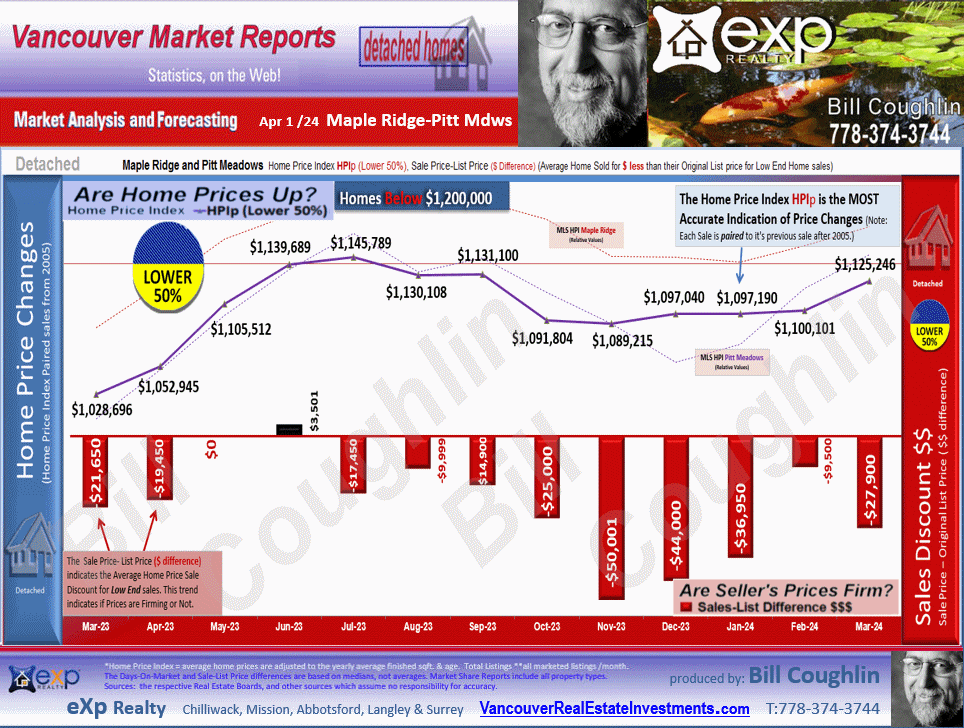
History: The Maple Ridge, Pitt Meadows Year-To-Date Home Price Index HPIp (Upper 50%) shows that prices increased $119,992.
The Maple Ridge, Pitt Meadows Year-To-Date Home Price Index HPIp (Lower 50%) shows that prices increased $106,005.
*The HPIp (Home Price Index) is an approximate reflection of the Average Home Price Changes.
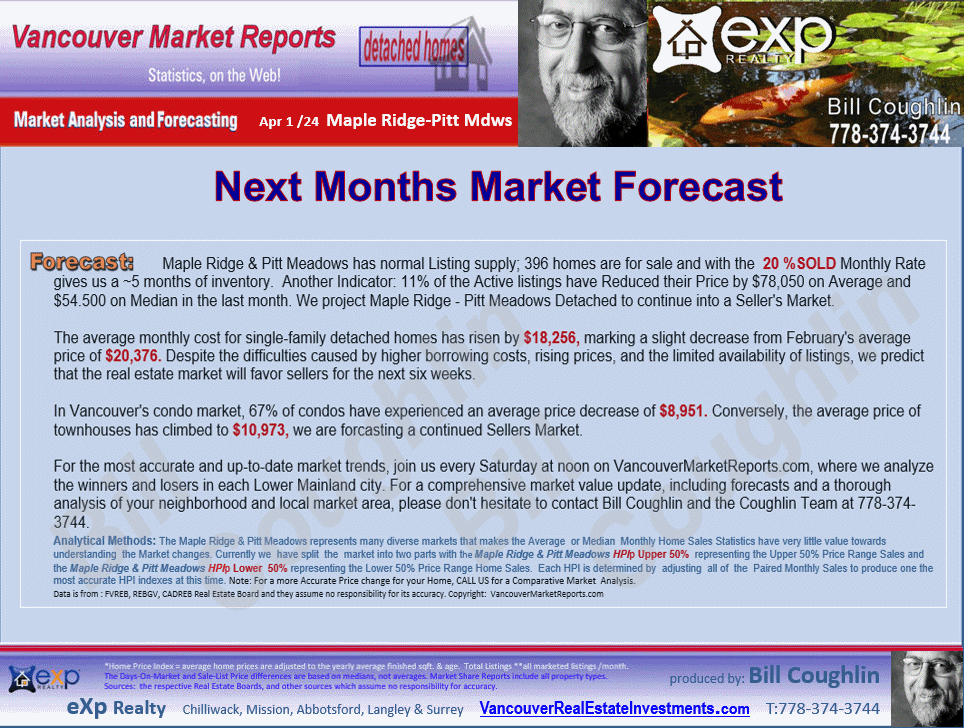
Forecast: Maple Ridge & Pitt Meadows has normal Listing supply; 396 homes are for sale and with the 20 %SOLD Monthly Rate gives us a ~5 months of inventory. Another Indicator: 11% of the Active listings have Reduced their Price by $78,050 on average and $54,500 on Median in the last month. We project Maple Ridge - Pitt Meadows Detached to continue into a Seller's Market.
Greater Vancouver March 2024:
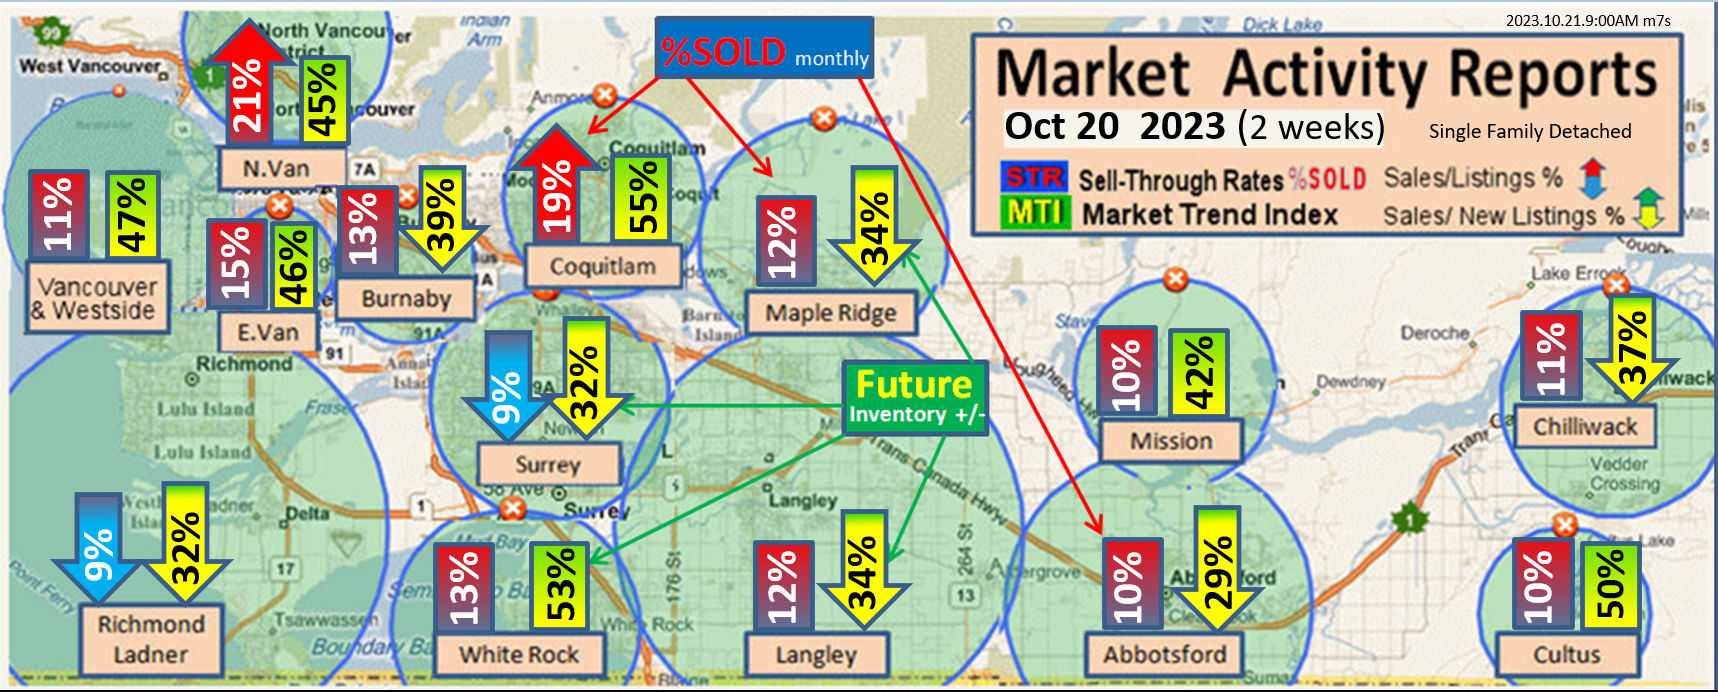
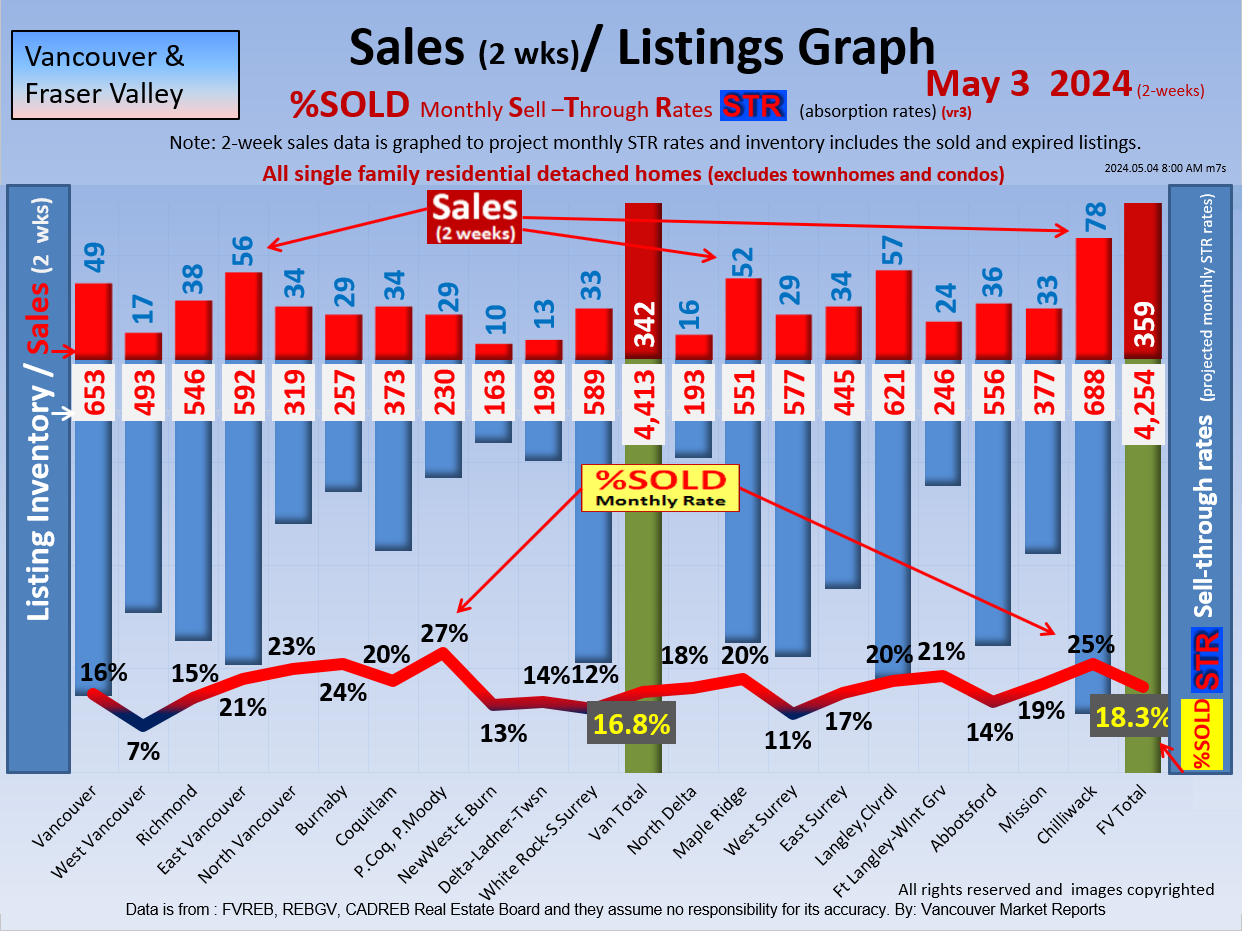
The average monthly cost for single-family detached homes has risen by $18,256, marking a slight decrease from February's average price of $20,376. Despite the difficulties caused by higher borrowing costs, rising prices, and the limited availability of listings, we predict that the real estate market will favor sellers for the next six weeks.
In Vancouver's condo market, 67% of condos have experienced an average price decrease of $8,951. Conversely, the average price of townhouses has climbed to $10,973, we are forcasting a continued Sellers Market.
For the most accurate and up-to-date market trends, join us every Saturday at noon on VancouverMarketReports.com, where we analyze the winners and losers in each Lower Mainland city. For a comprehensive market value update, including forecasts and a thorough analysis of your neighborhood and local market area, please don't hesitate to contact Bill Coughlin and the Coughlin Team at 778-374-3744.
Fraser Valley March 2024:
The average monthly cost for single-family detached homes has risen by $13,015, marking a slight decrease from February's average price of $19,686. Despite the difficulties caused by higher borrowing costs, rising prices, and the limited availability of listings, we predict that the real estate market will favor sellers for the next six weeks.
In Fraser Valley's condo market, 75% of condos have experienced an average price decrease of $3,434. Conversely, the townhouse market's average price has climbed to $9,716, we are forcasting a continued Sellers Market.
For the latest and most accurate market trends, join us every Saturday at noon on VancouverMarketReports.com, where we analyze the performance of winners and losers in each Lower Mainland city. For a comprehensive market value update, including forecasts and a thorough analysis of your neighborhood and local market area, feel free to reach out to Bill Coughlin and the Coughlin Team at 778-374-3744.
|

