|
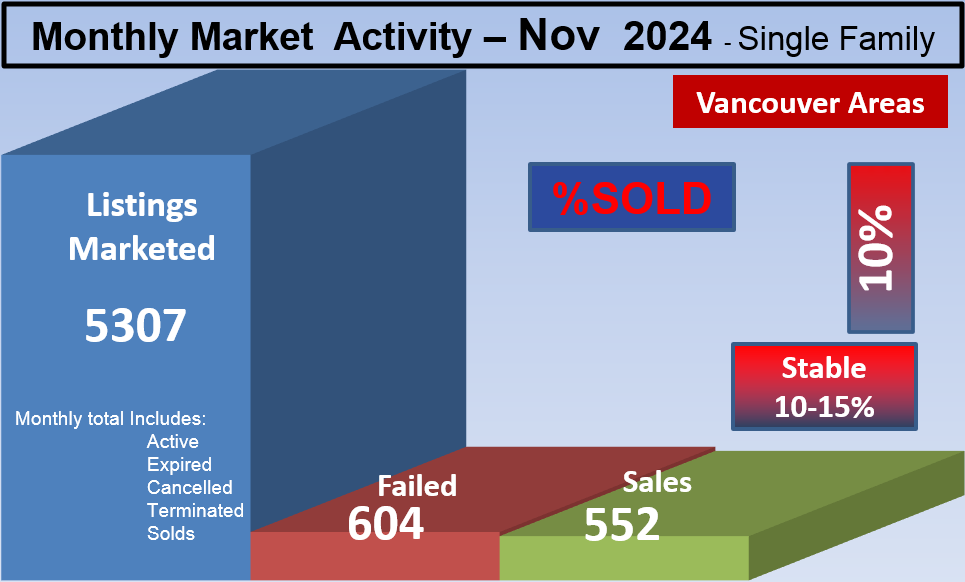
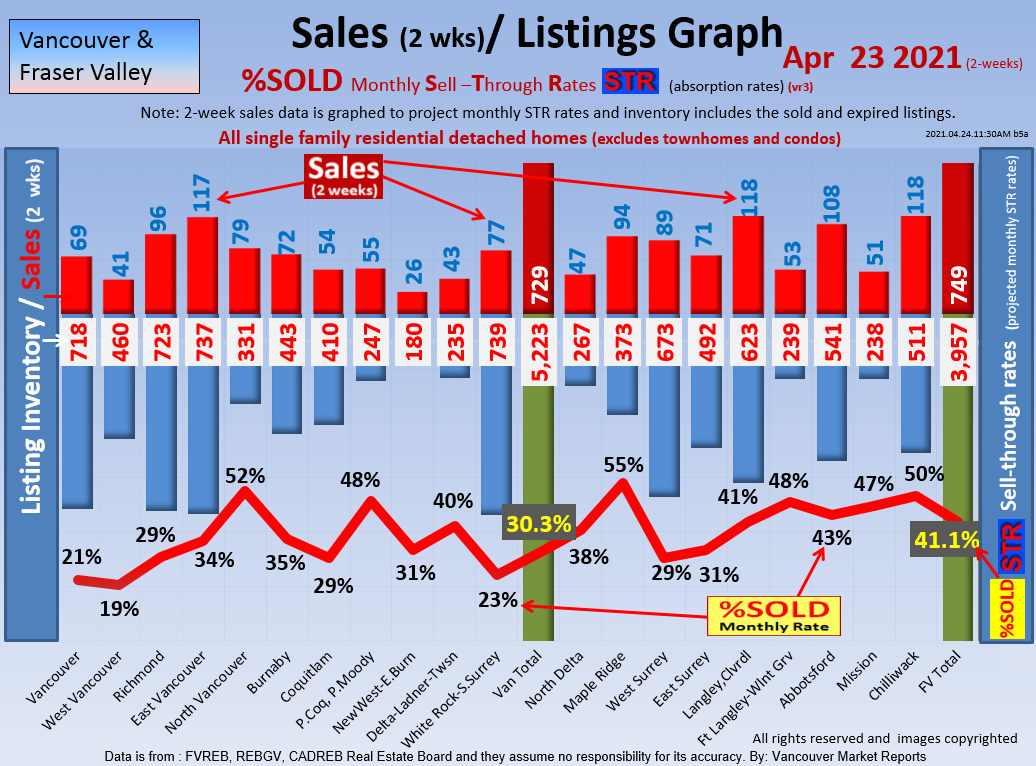
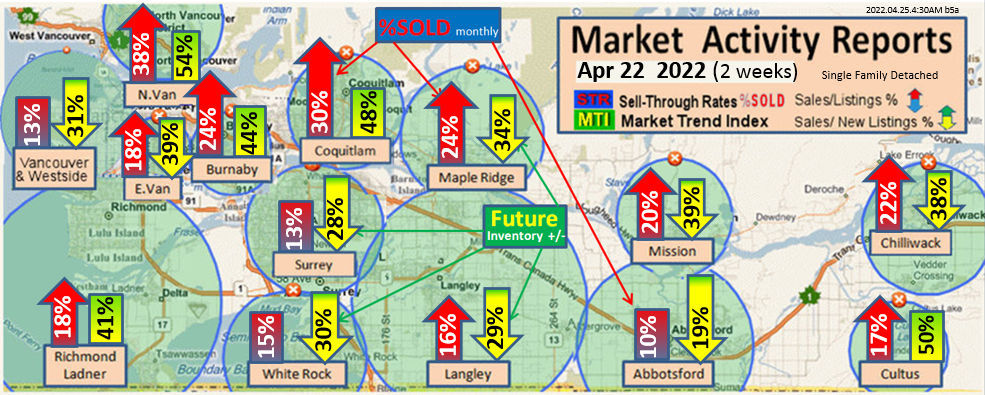
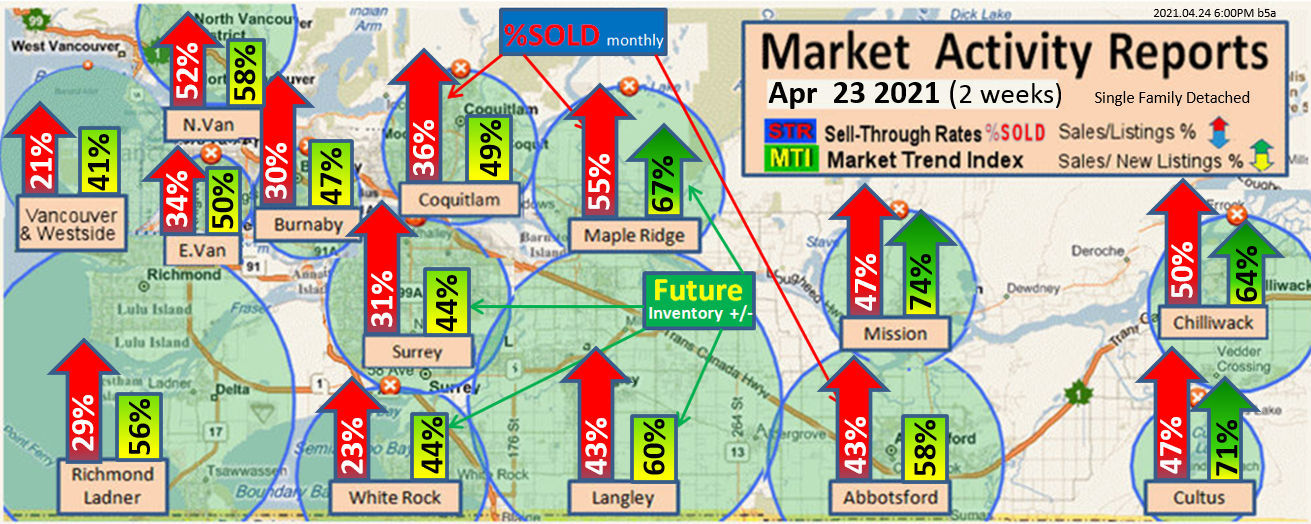
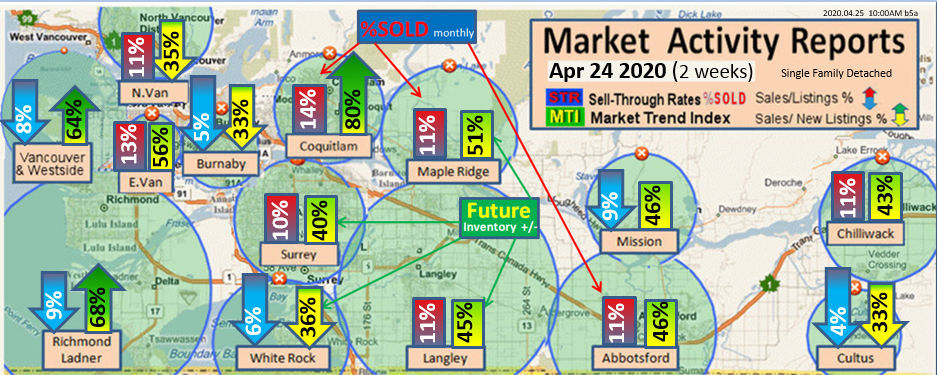
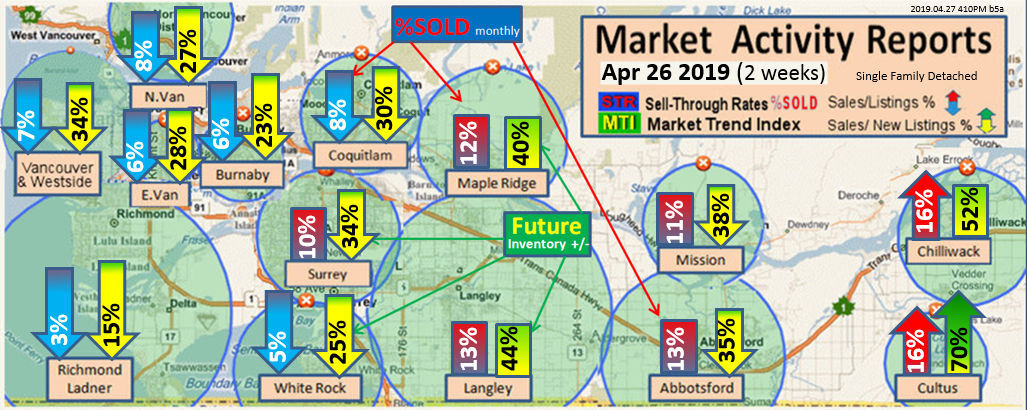
Vancouver Area Jan. 23, 2025 (2-week update) (Click here)
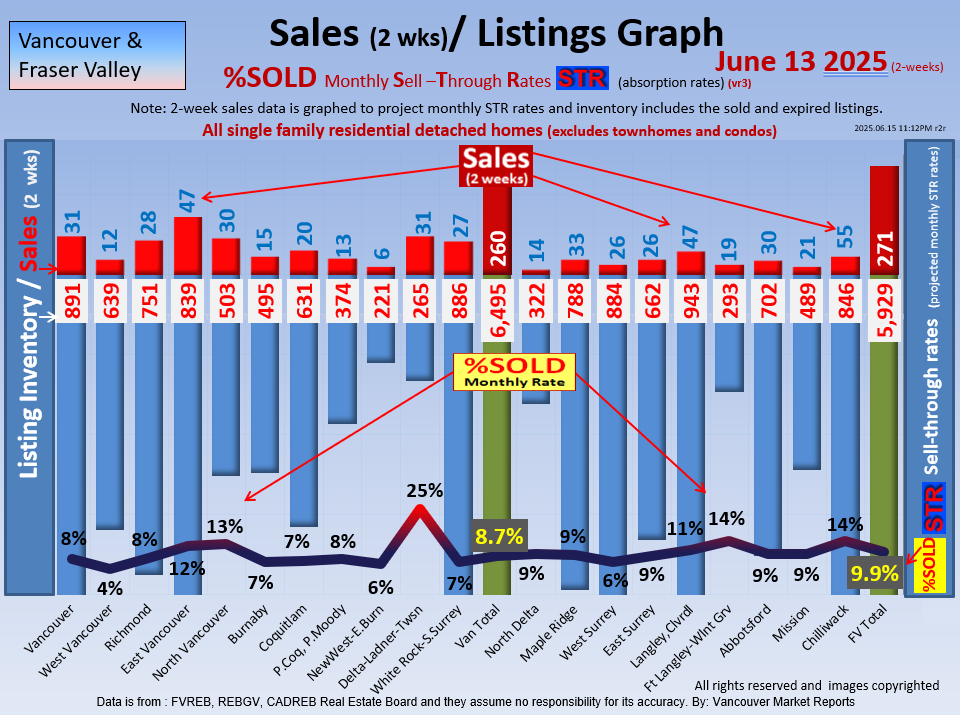
Current: Vancouver area Real Estate Market is in Buyer's with an average of 6.3% SOLD rate. See each city for the full details.
Forecast:
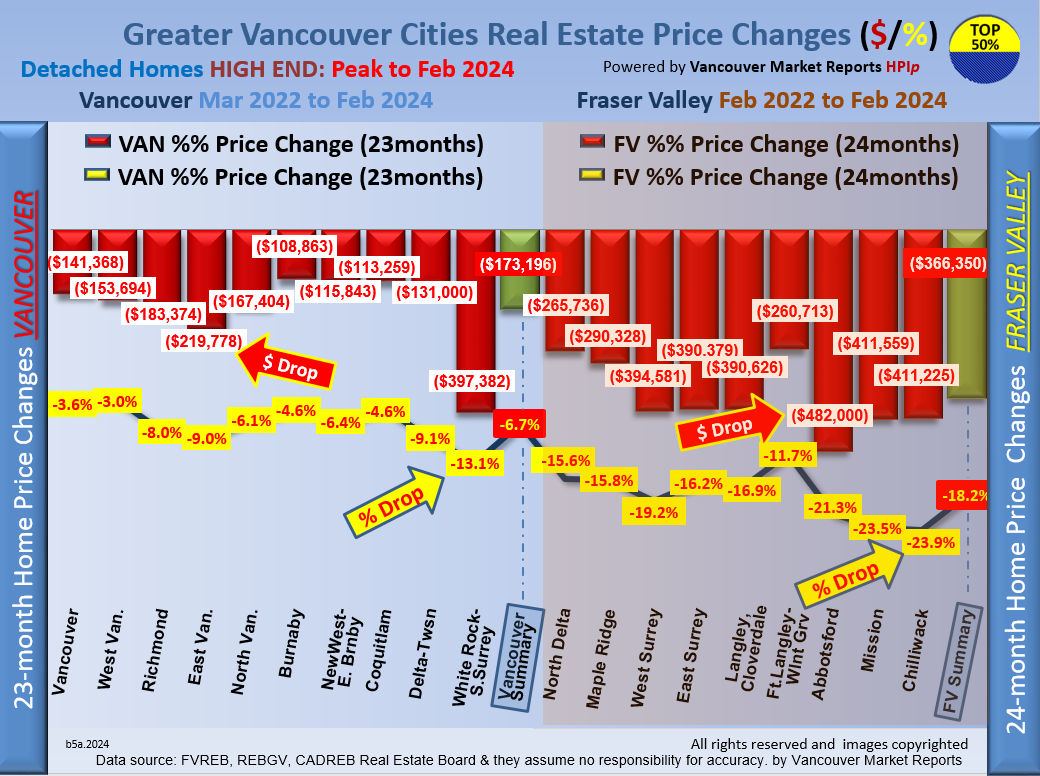
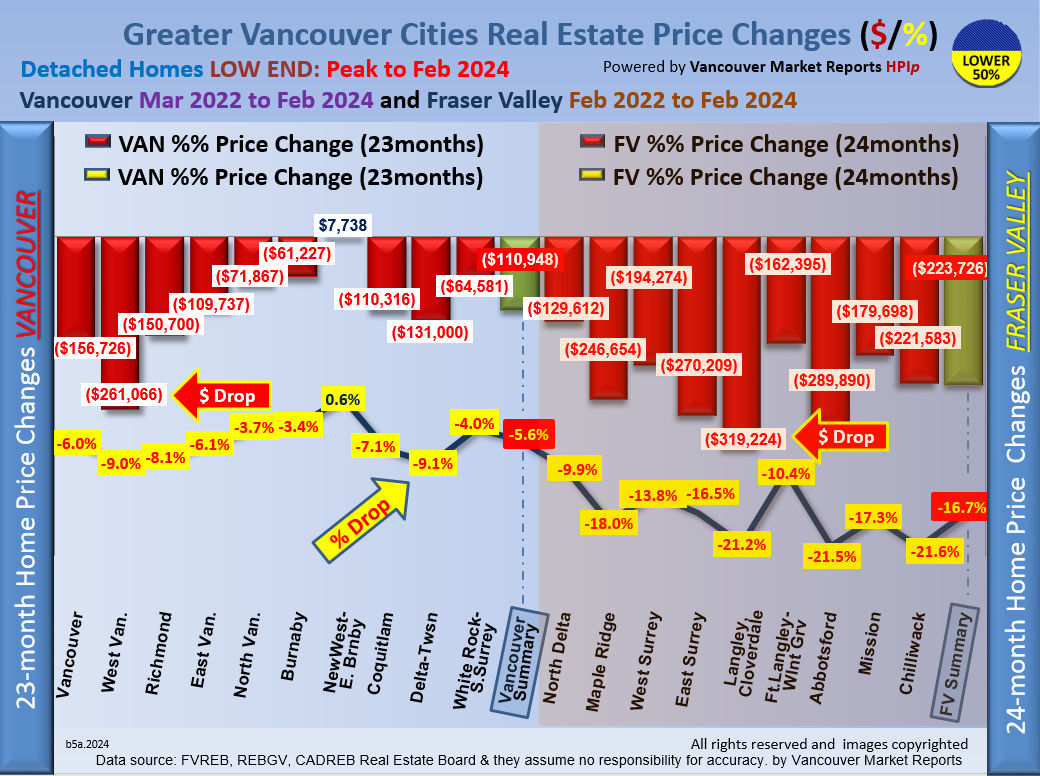
The market continues to cool, and buyers are firmly in control. In December 2025, about 86% of single-family homes lost value across Greater Metro Vancouver. The average price dropped $21,298, which is a slight improvement from November’s sharper $23,410 drop.
Sales remained slow due to affordability pressures, economic uncertainty, and high inventory levels. Apartments and attached homes saw the largest price declines, leading the market downward.
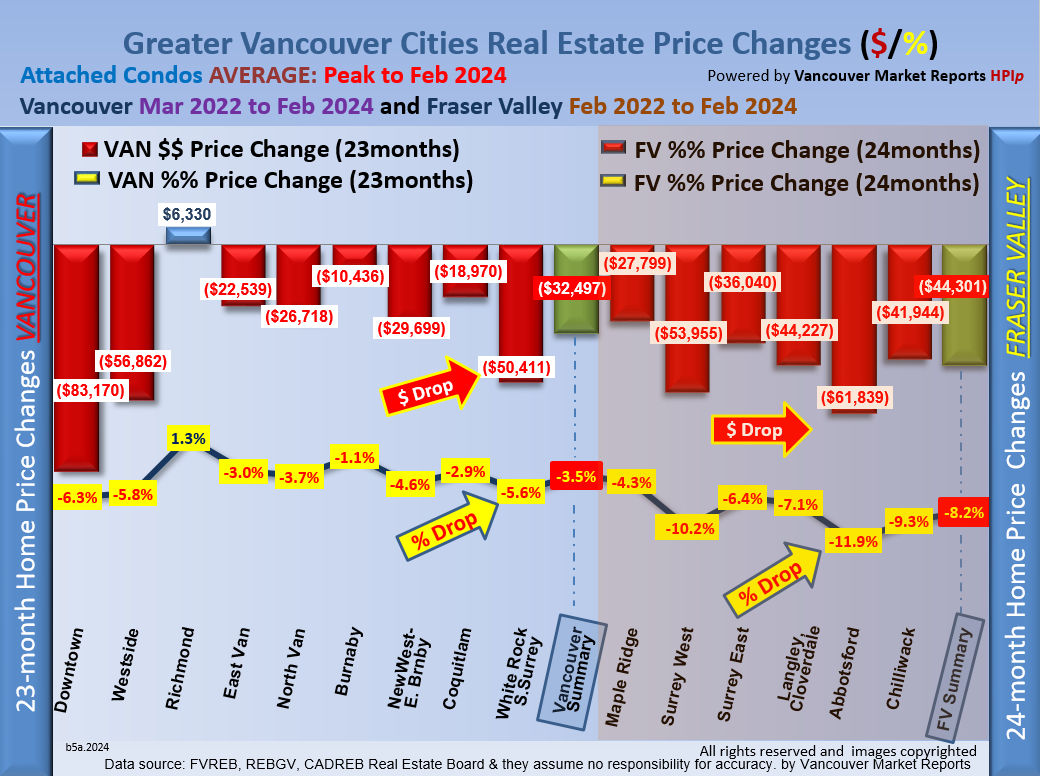
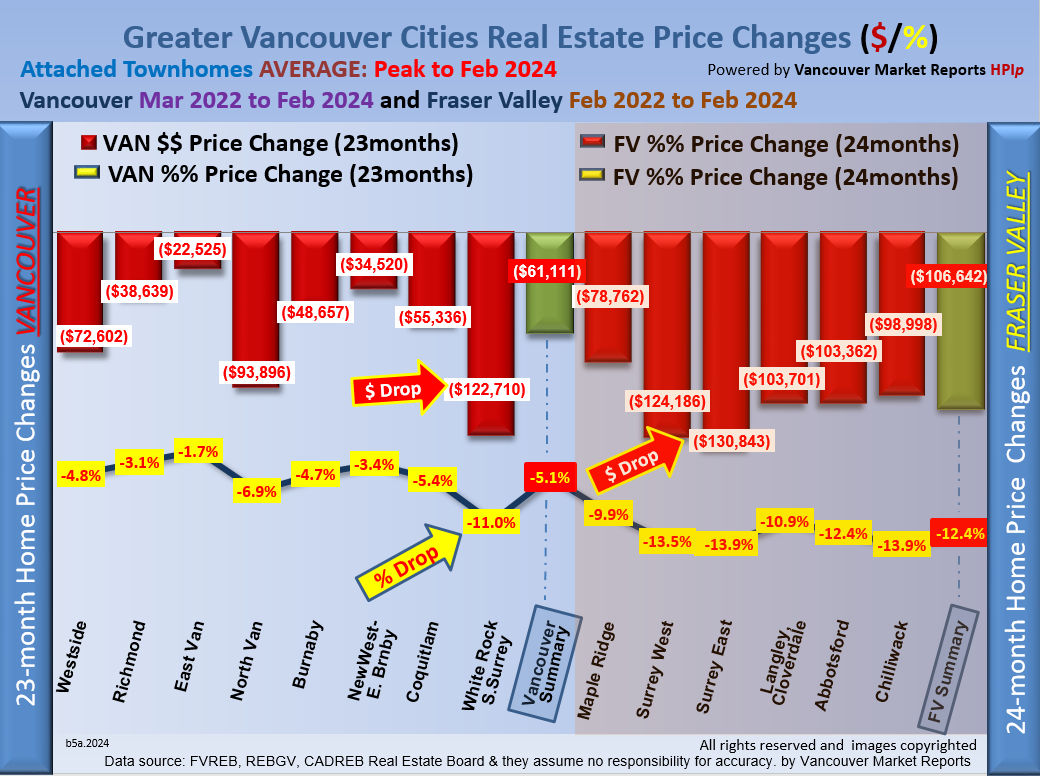
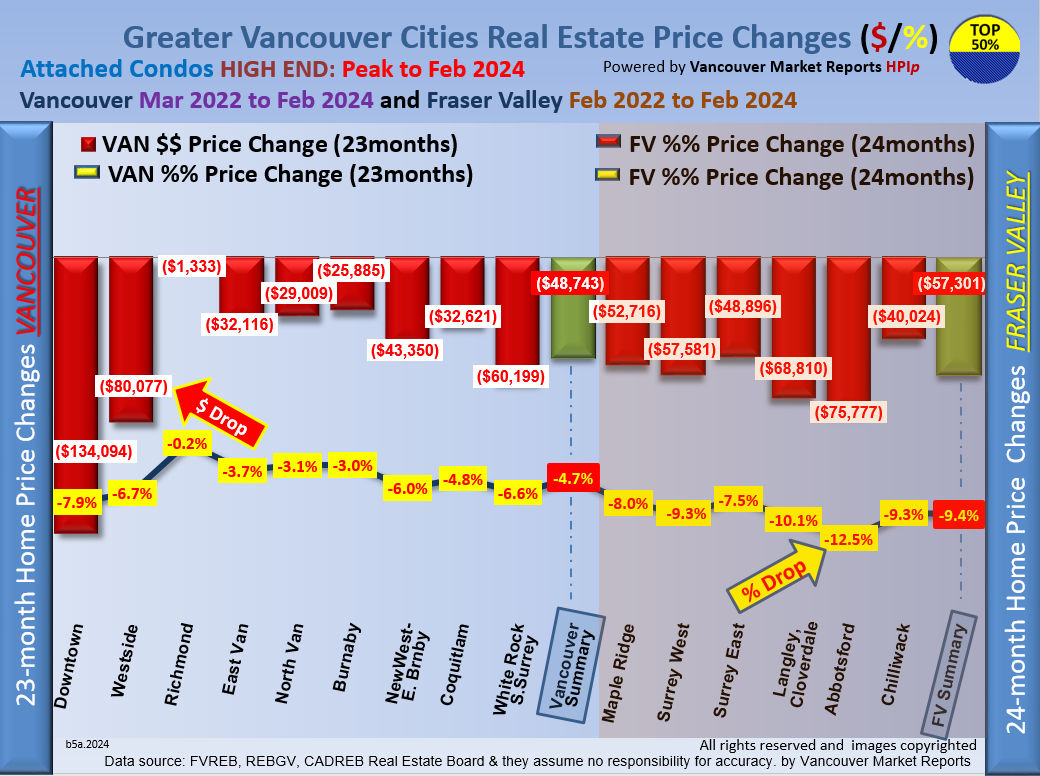
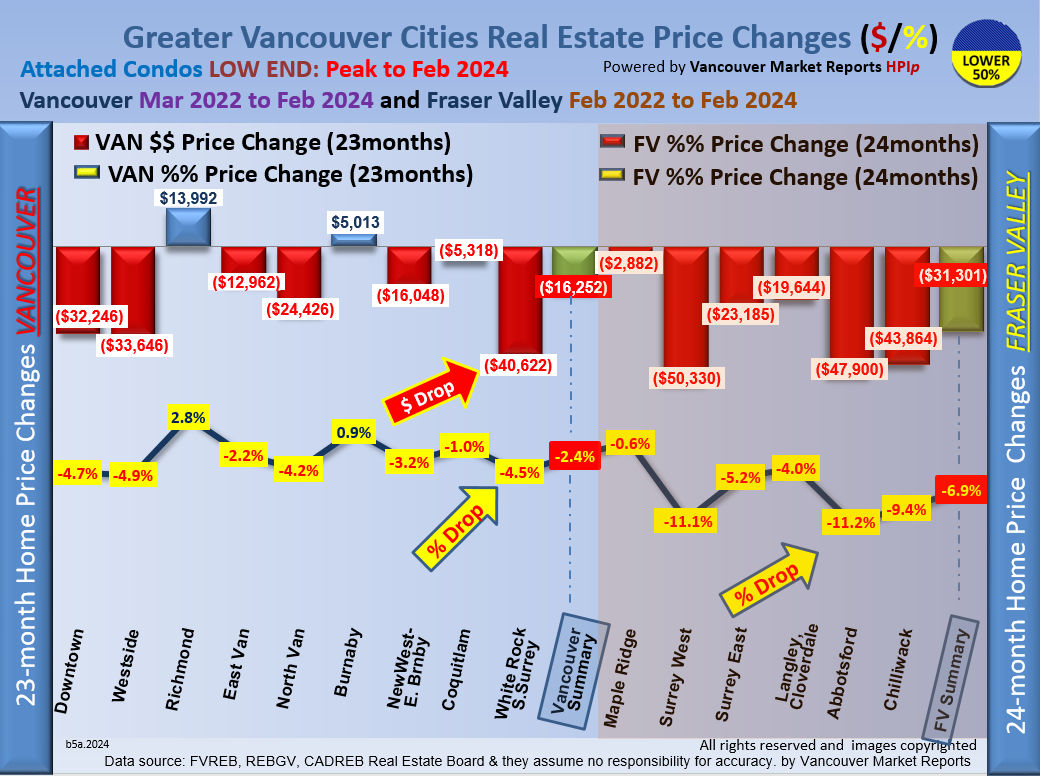
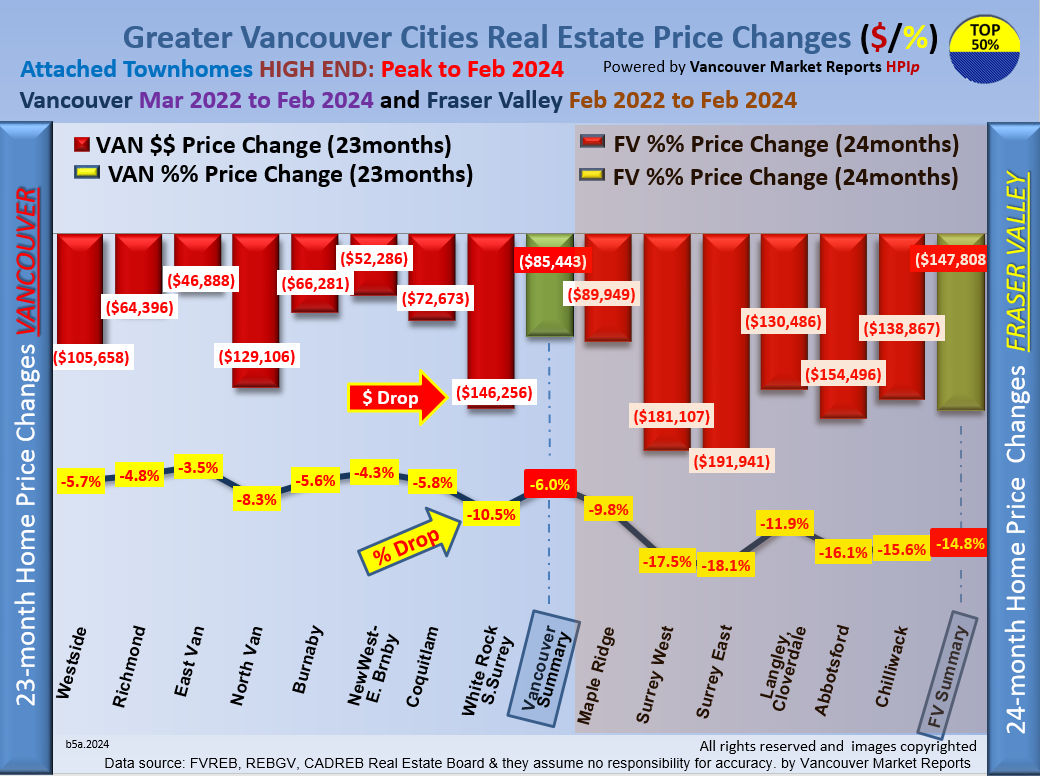
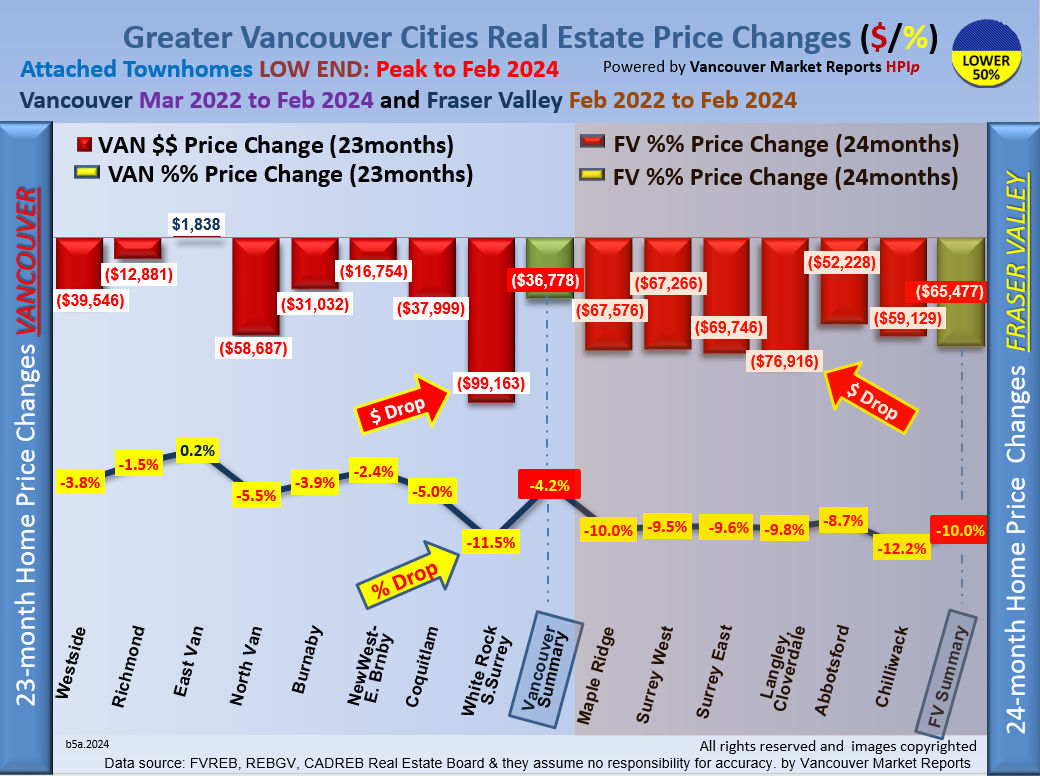
Condos faced an even more challenging month, with 67% losing value and average prices dropping by $4,843. Townhome values were unchanged, posting the same $6,010 decline as in December. With trade negotiations and tariff concerns still in the spotlight, prices for condos and townhouses, we are forecasting that these lower prices could help set the stage for a modest rebound in sales in 2026 and stabilizing the market in the next 3 months.
The positive takeaway? Conditions strongly favor buyers right now. Sellers, however, will need a well-planned strategy to achieve the best possible value.
Wondering which neighbourhoods are gaining momentum—or slowing? Visit VancouverMarketReports.com every Saturday at noon for the latest insights. 📞 For expert guidance or a free Home Market Analysis, call Bill Coughlin and the Coughlin Team at 778-374-3744—we’re here to help you make the right move.
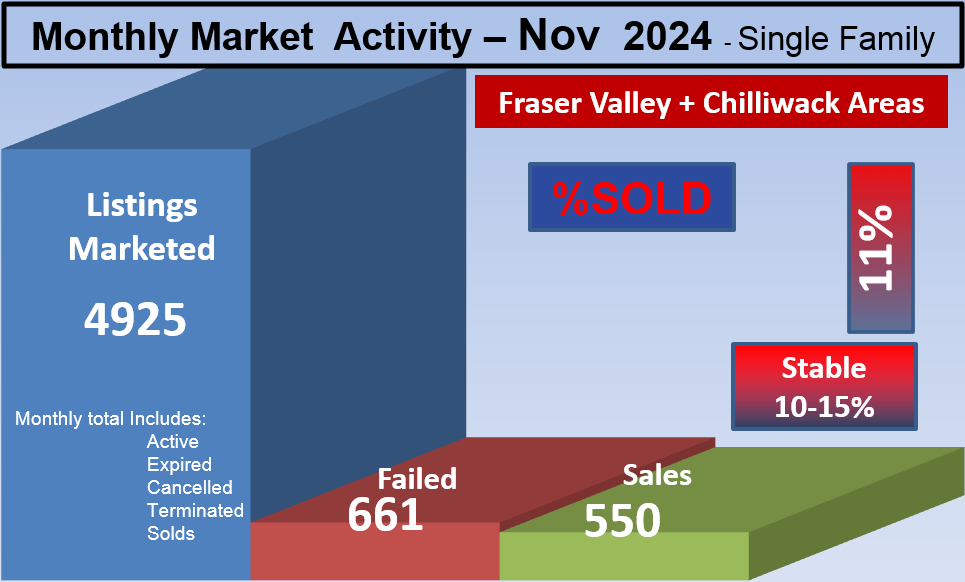
.Fraser Valley & Chilliwack Jan. 23, 2025 (2-week update)
Current: Fraser Valley and the Chilliwack areas in Buyer's Market averaging a 7.6%SOLD rate. See each city link for the full details
Forecast:
The Fraser Valley market continued to cool in December 2025, but the pace of decline slowed sharply. About 33% of single-family homes lost value, with average prices down $7,120. That is a major improvement from November’s much steeper $32,659 drop.
Sales remained slow due to affordability challenges, economic uncertainty, and high inventory, keeping buyers firmly in control. While conditions are still soft, the smaller price adjustment suggests the market may be starting to stabilize compared to late fall. Bottom line: prices are correcting at a slower rate, buyers still have leverage, and the Fraser Valley is holding up better than Metro Vancouver.
Condos faced an even more challenging month, with 75% losing value and average prices dropping by $5,257. Townhome values were unchanged, posting the same $5,805 decline as in December. With trade negotiations and tariff concerns still in the spotlight, prices for condos and townhouses, we are forecasting that these lower prices could help set the stage for a modest rebound in sales in 2026 and stabilizing the market in the next 3 months.
The positive takeaway? Conditions strongly favor buyers right now. Sellers, however, will need a well-planned strategy to achieve the best possible value.
The takeaway? This is a great time for buyers to step in. Sellers, however, need a sharp strategy to secure the best deal.
Wondering which neighbourhoods are gaining momentum—or slowing? Visit VancouverMarketReports.com every Saturday at noon for the latest insights. 📞 For expert guidance or a free Home Market Analysis, call Bill Coughlin and the Coughlin Team at 778-374-3744—we’re here to help you make the right move.
|


.jpg)