|
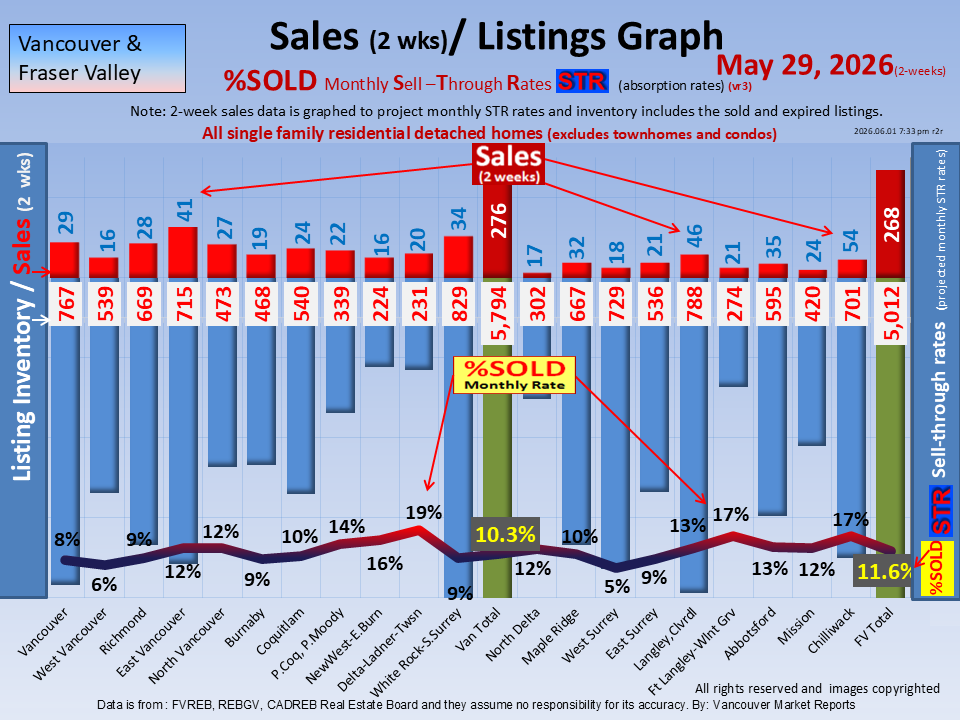
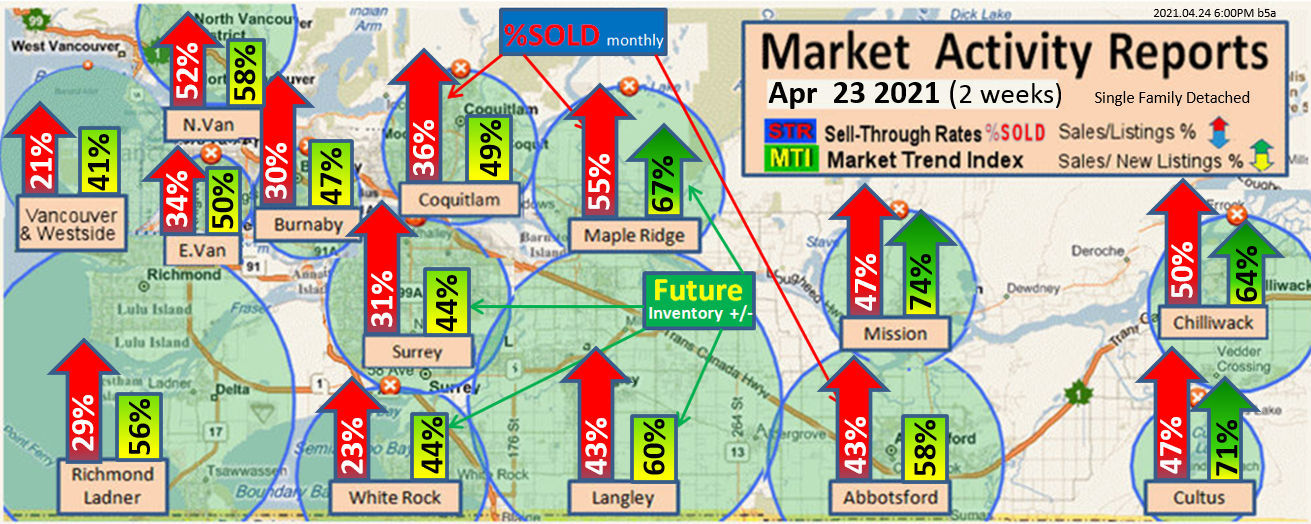
Vancouver Area July 10, 2026 (2-week update) (Click here)
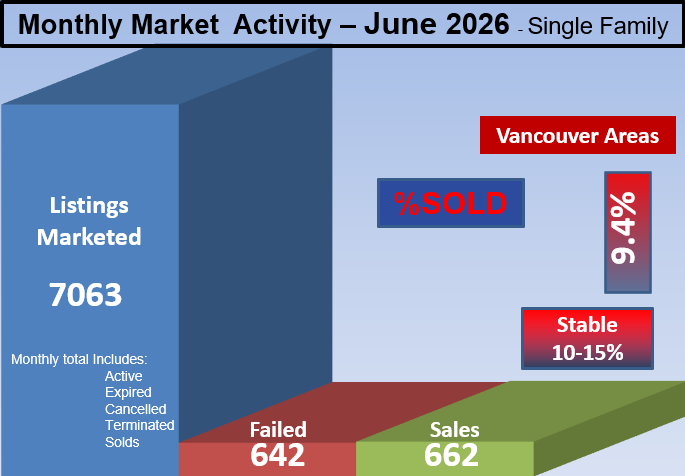
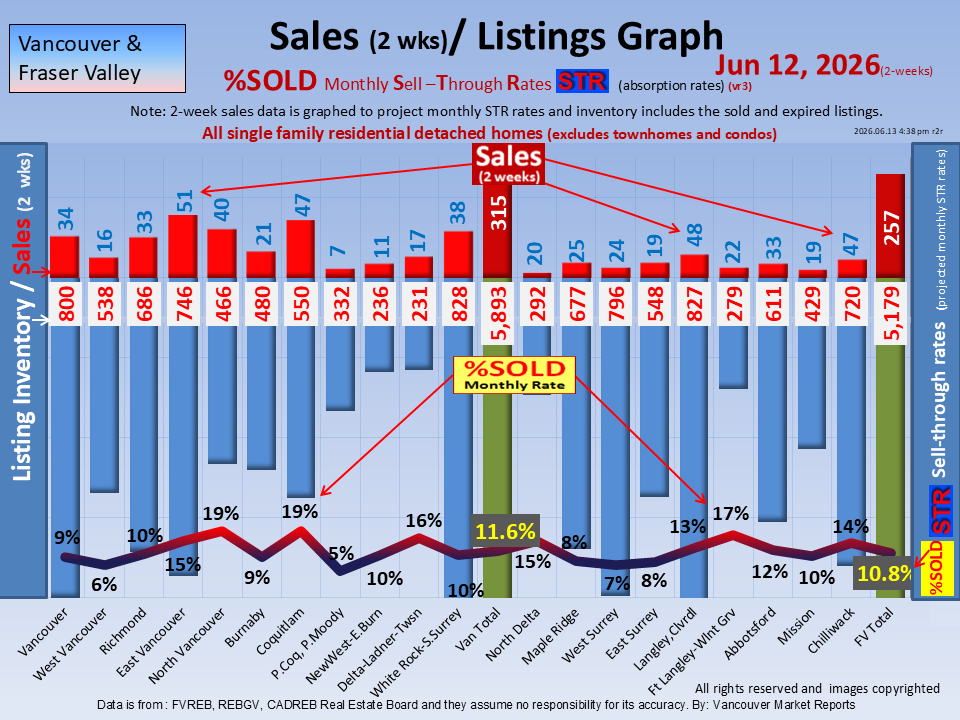
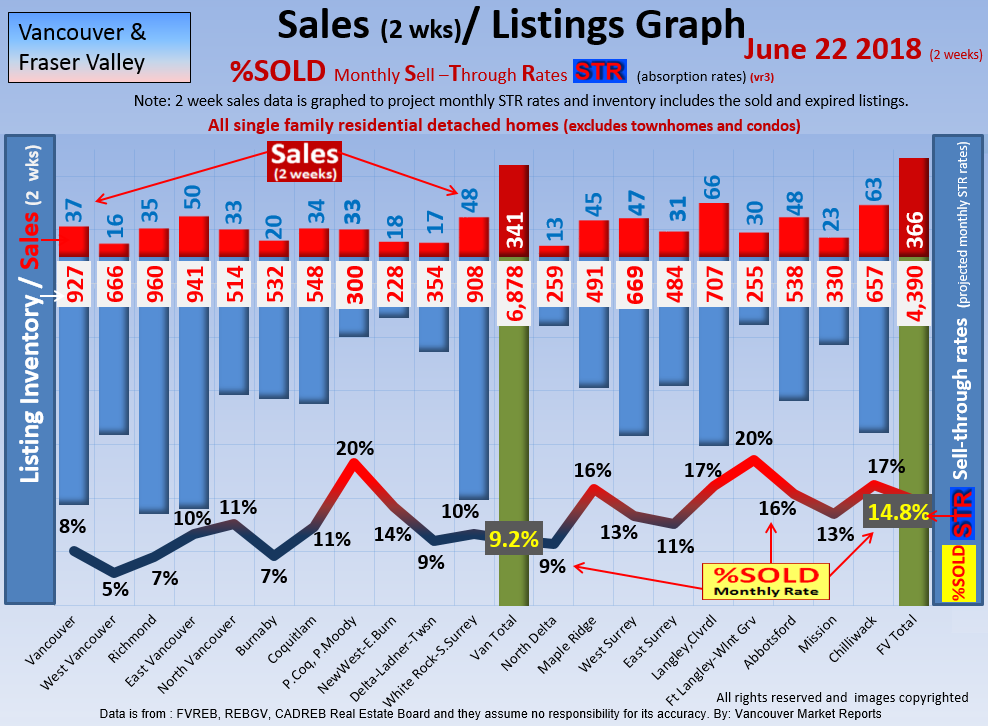
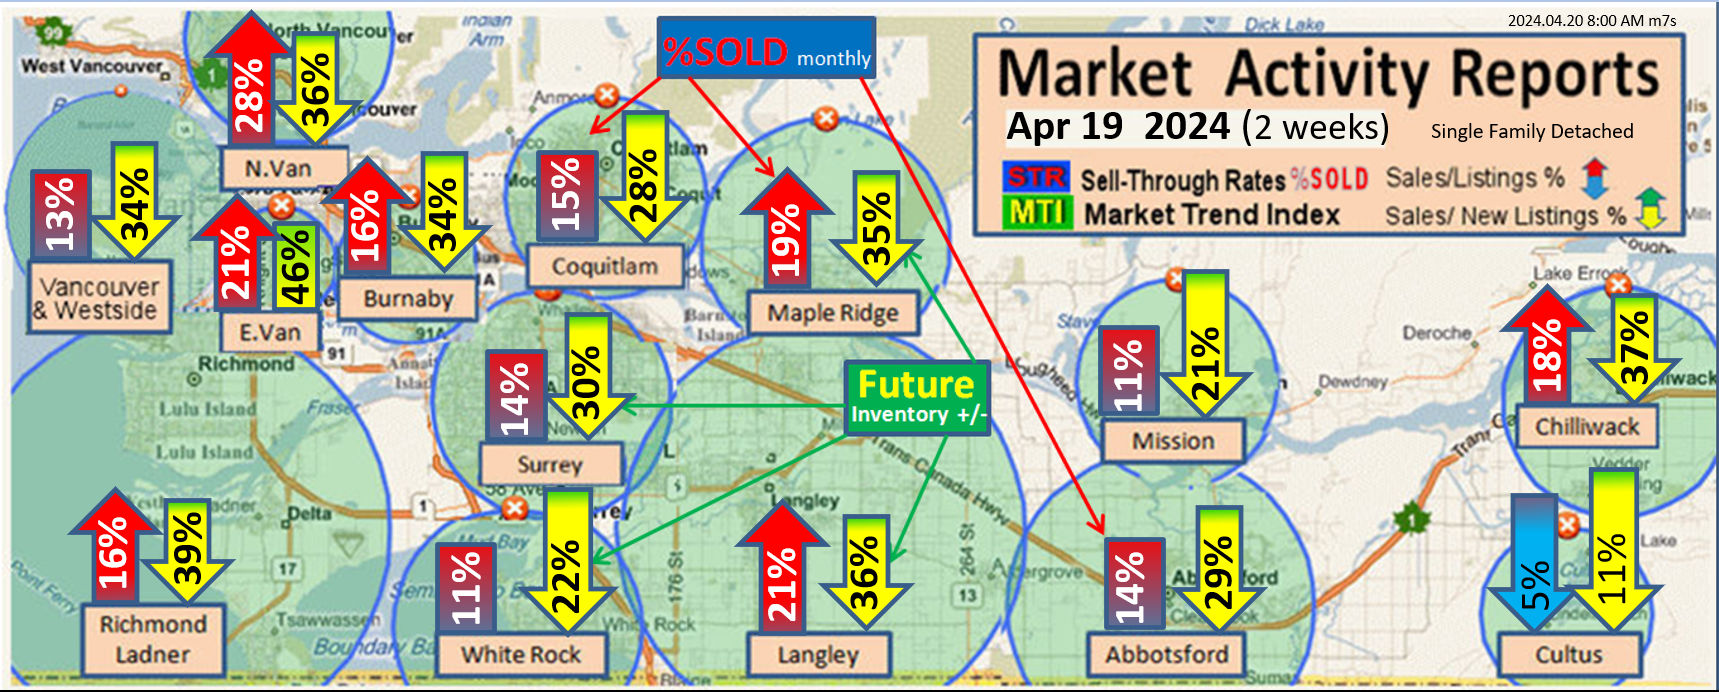
Current: Vancouver area Real Estate Market is in Stable with an average of 9.2% SOLD rate. See each city for the full details.
Forecast:
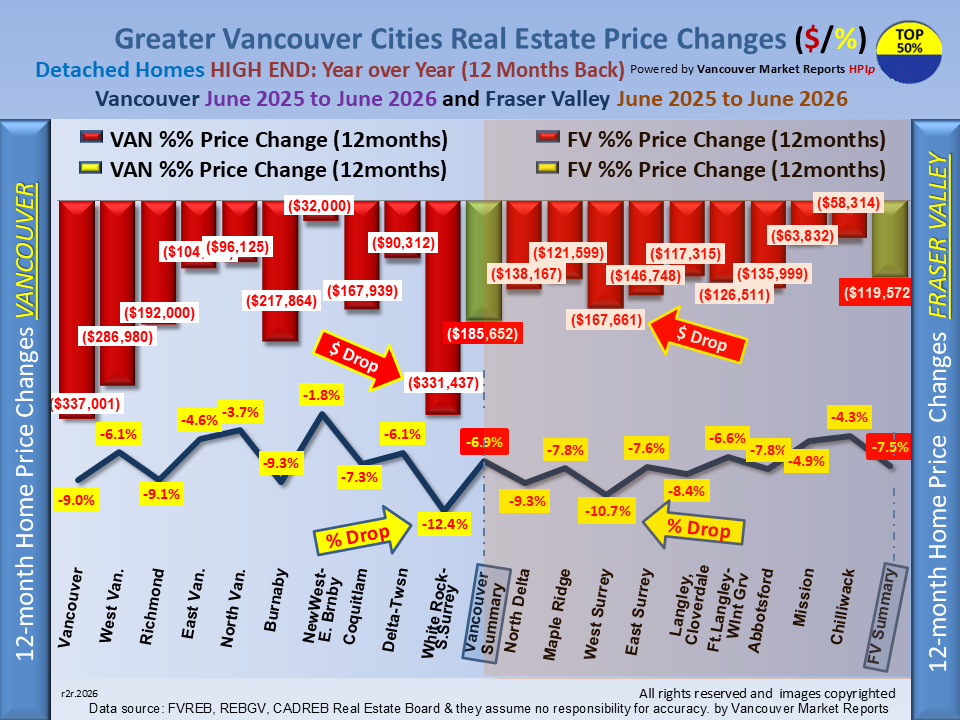
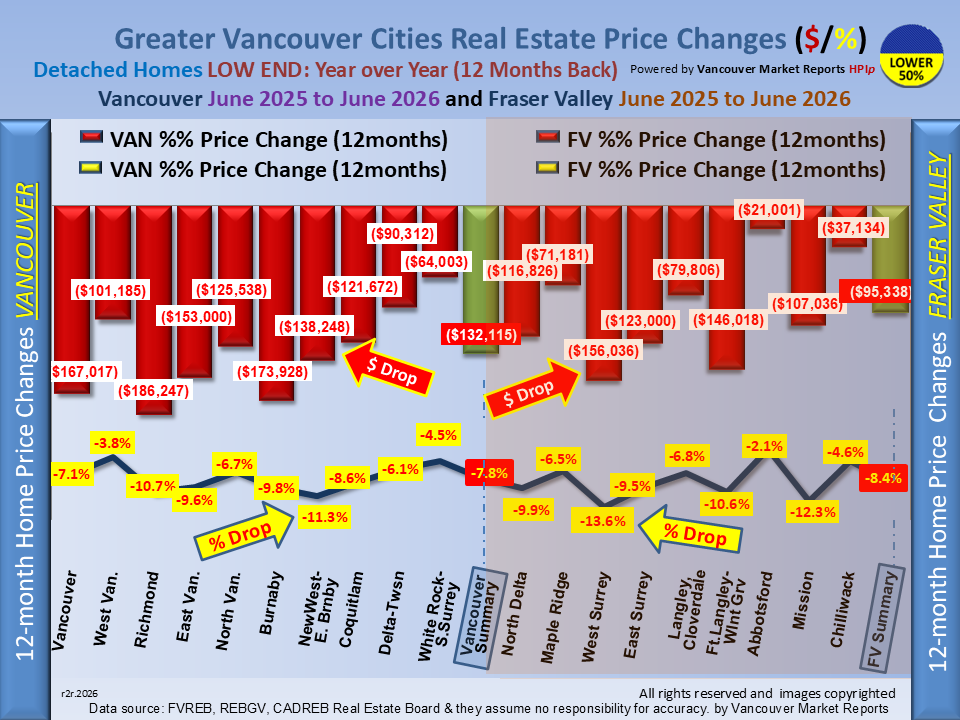
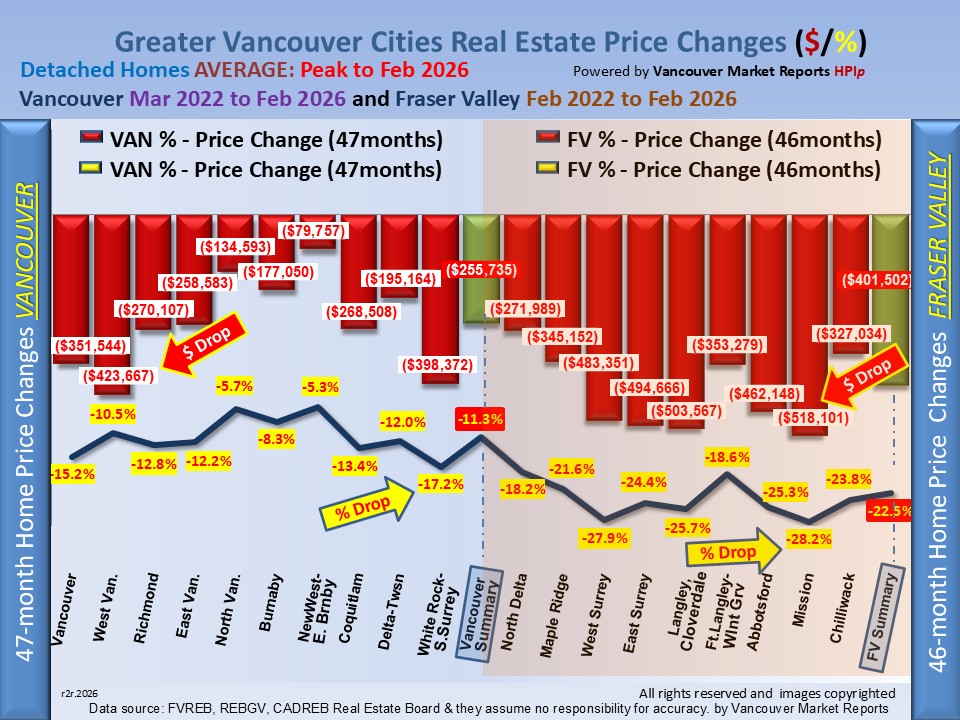
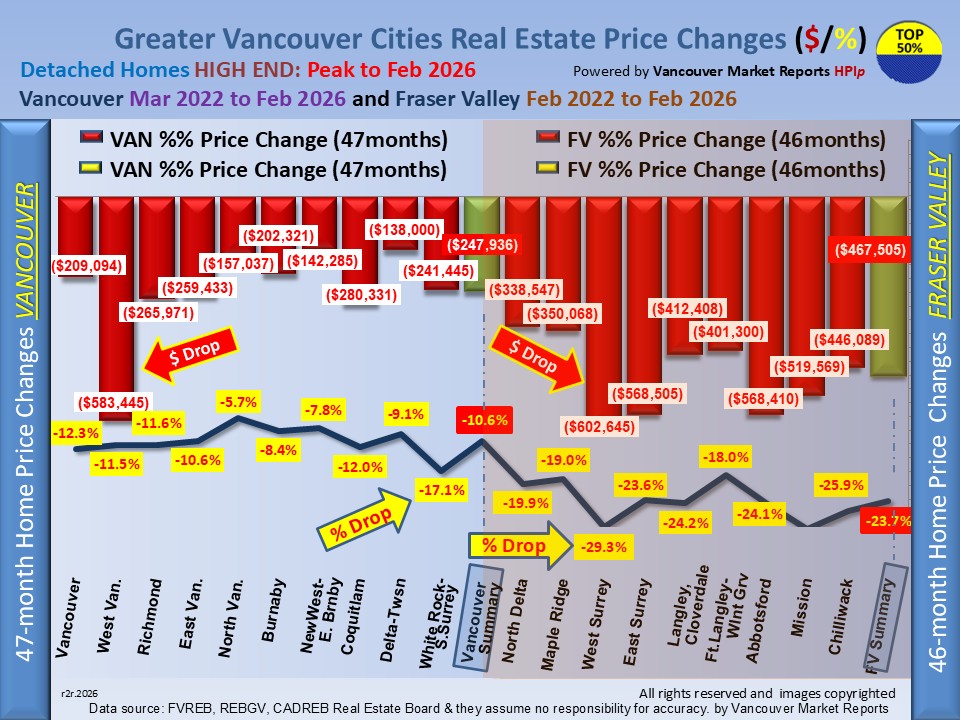
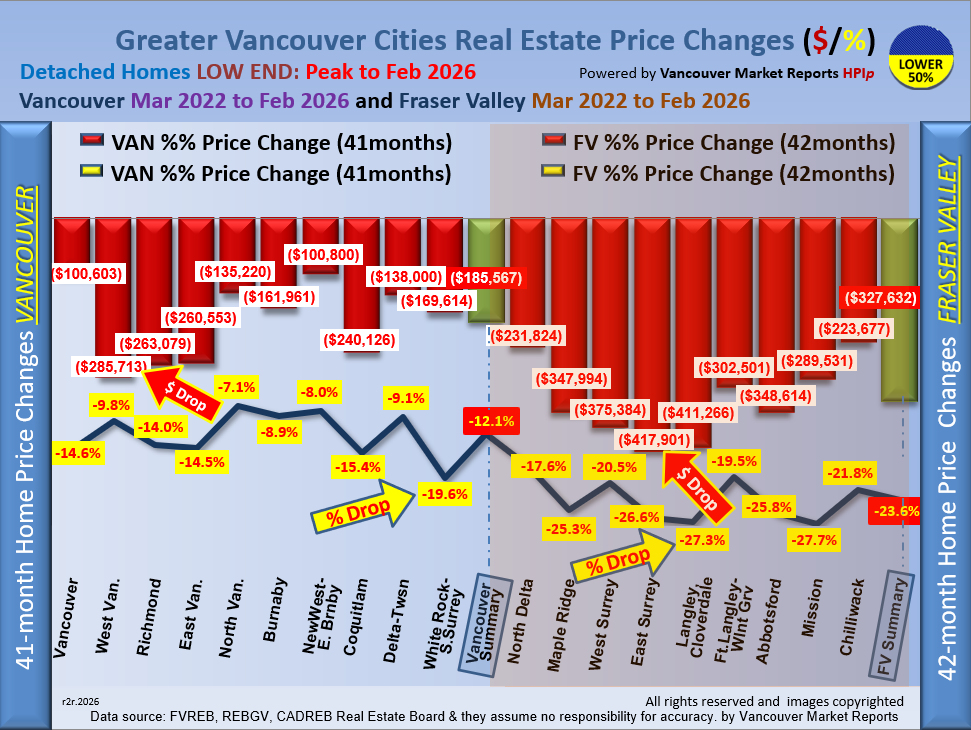
The Metro Vancouver housing market slowed down in June. Detached home prices dropped by an average of $10,632. While this was a smaller drop than May's average decline of $12,351, 67% of detached home markets are still seeing prices fall.
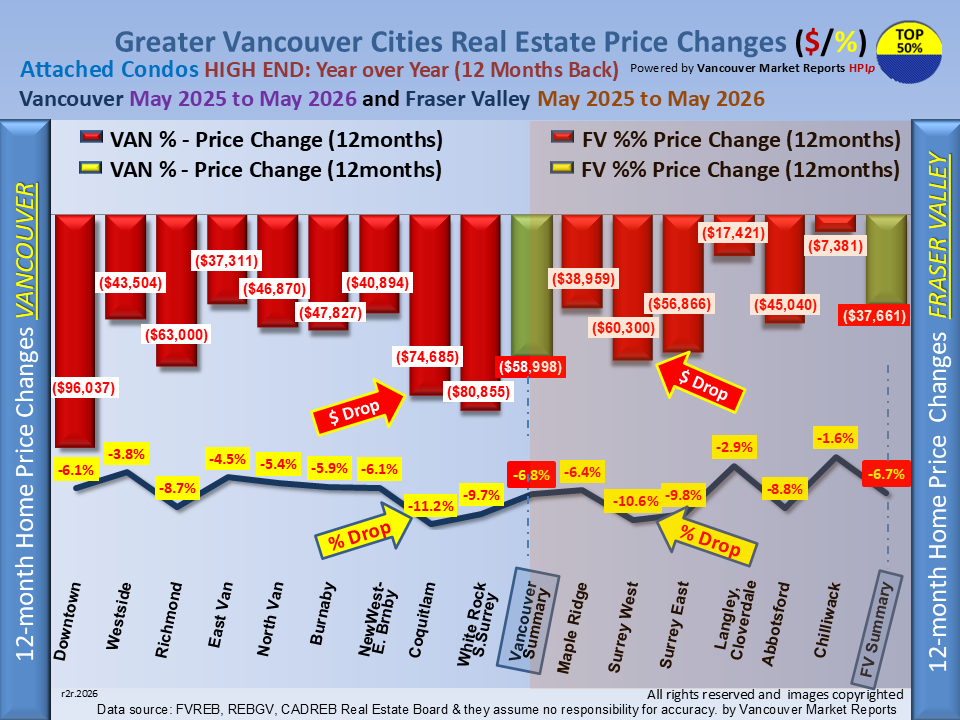
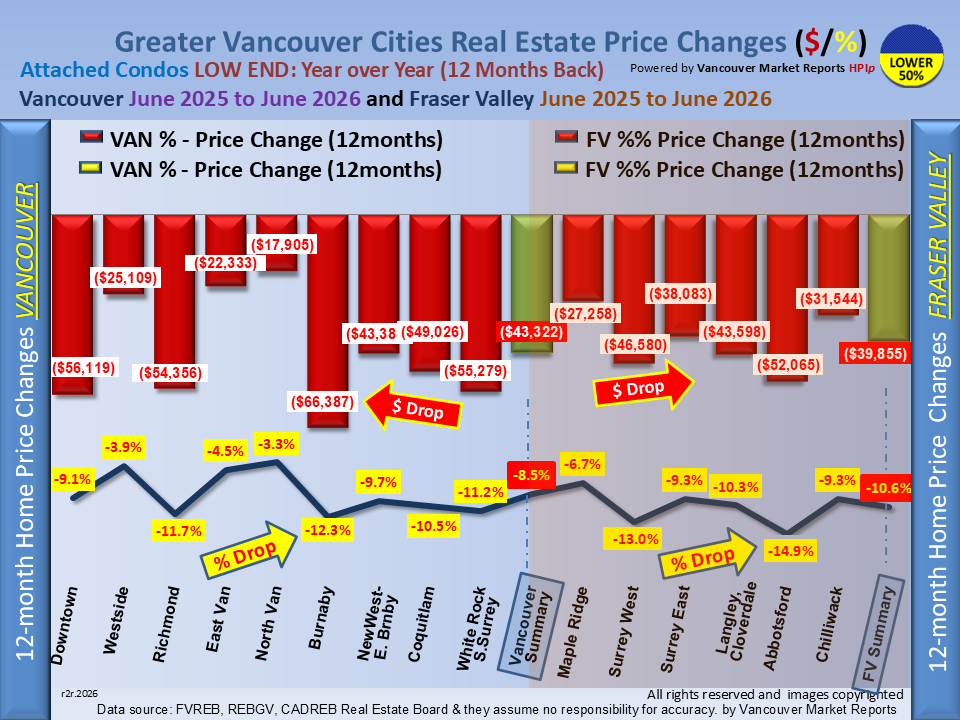
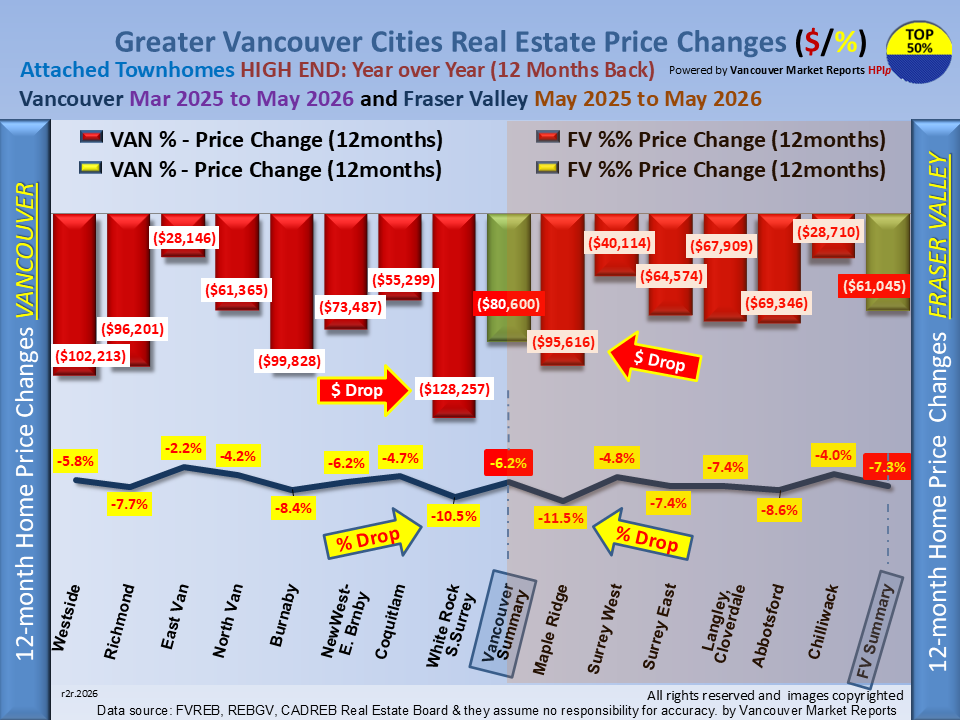
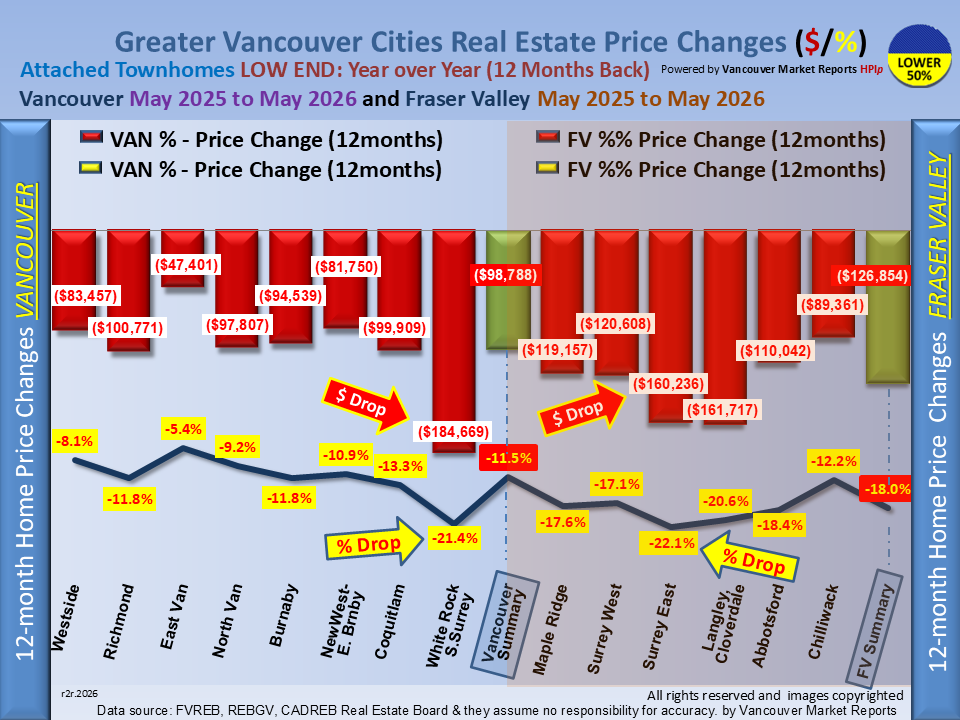
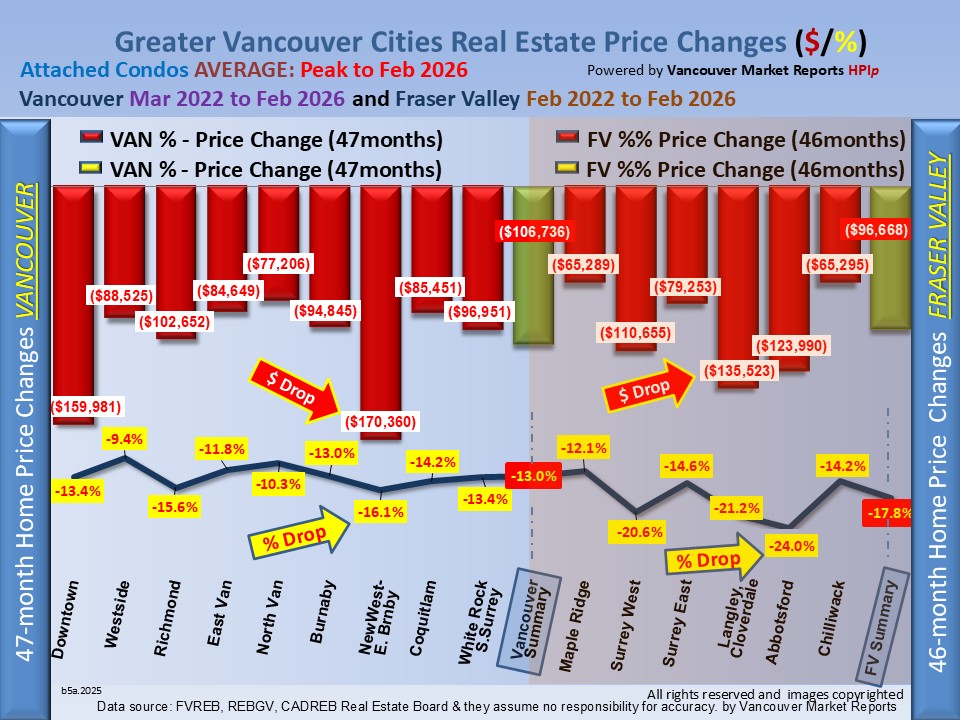
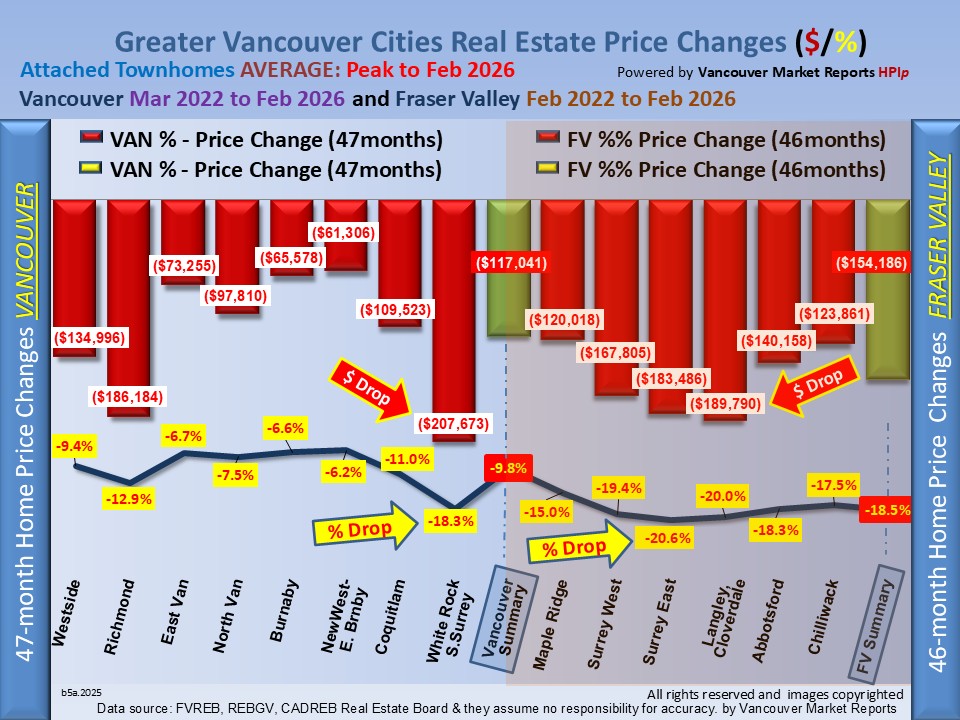
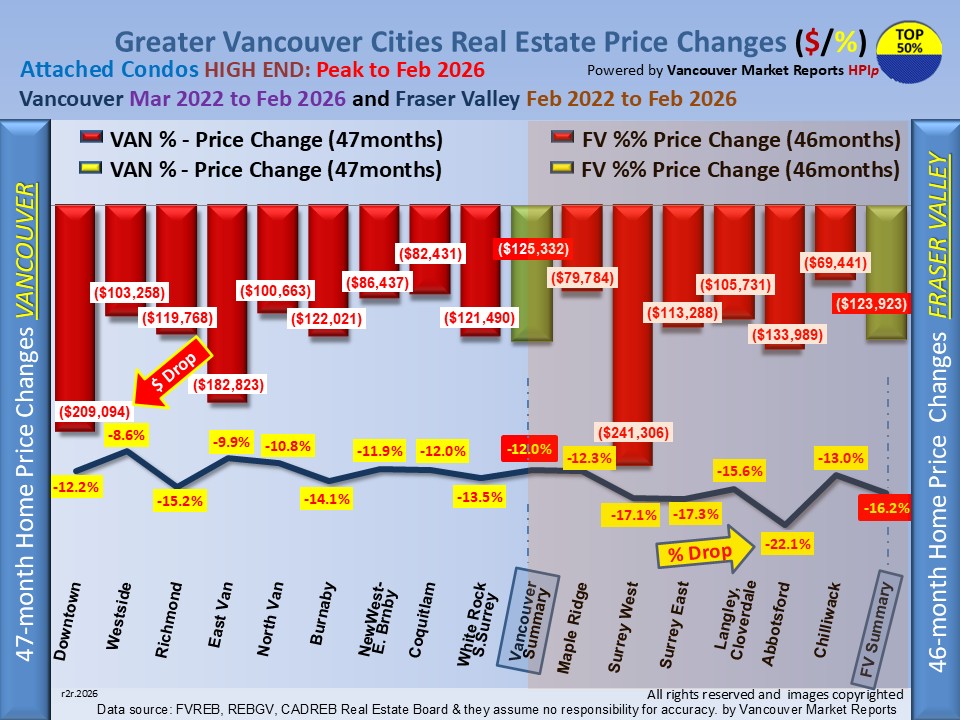
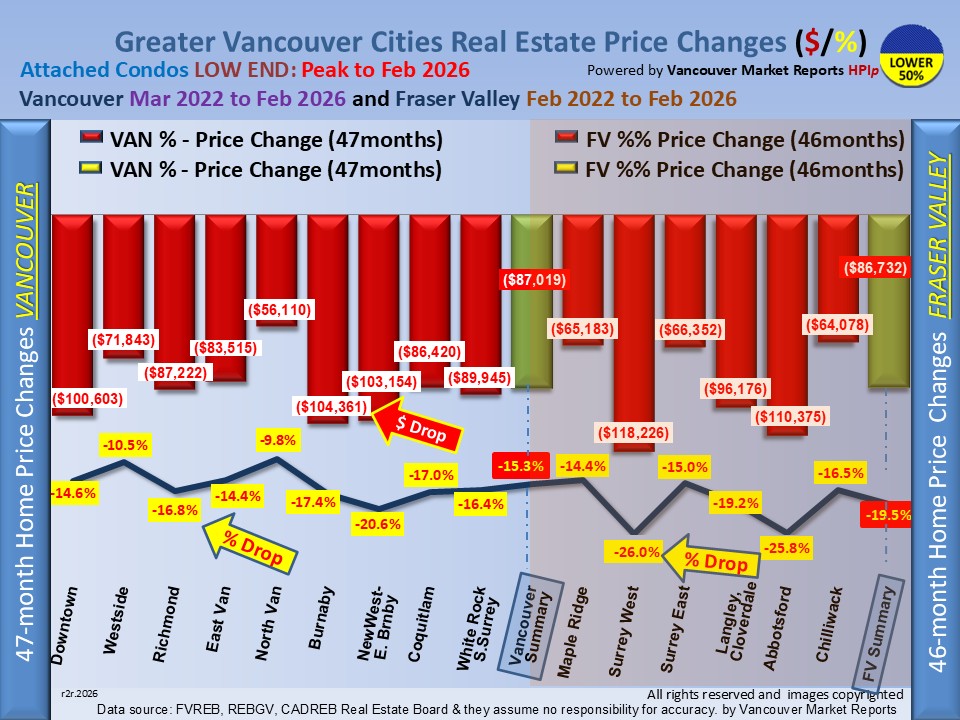
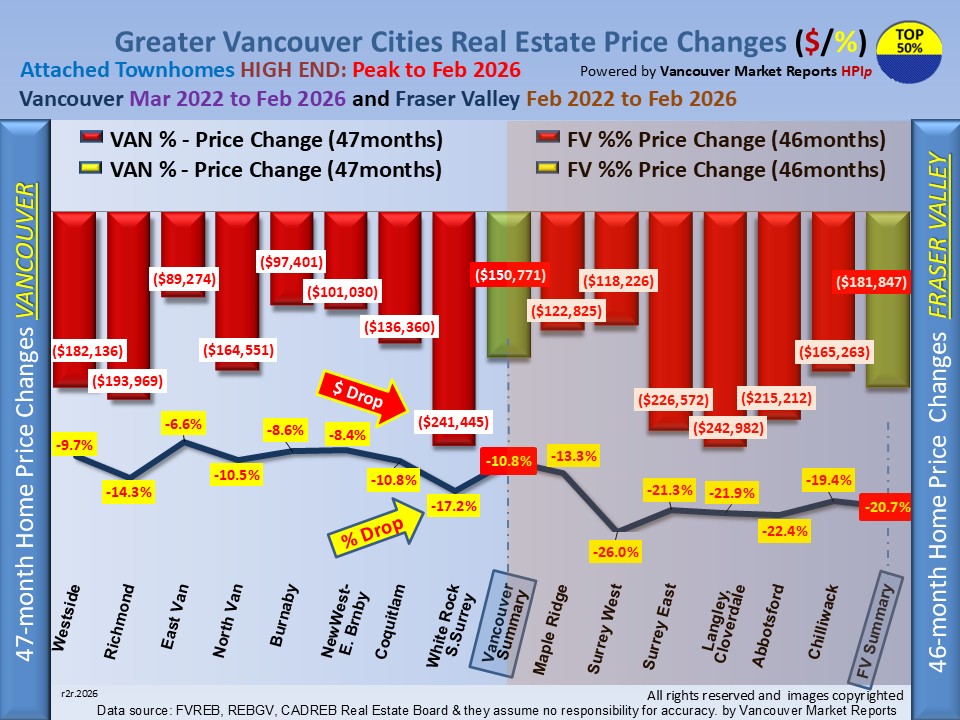
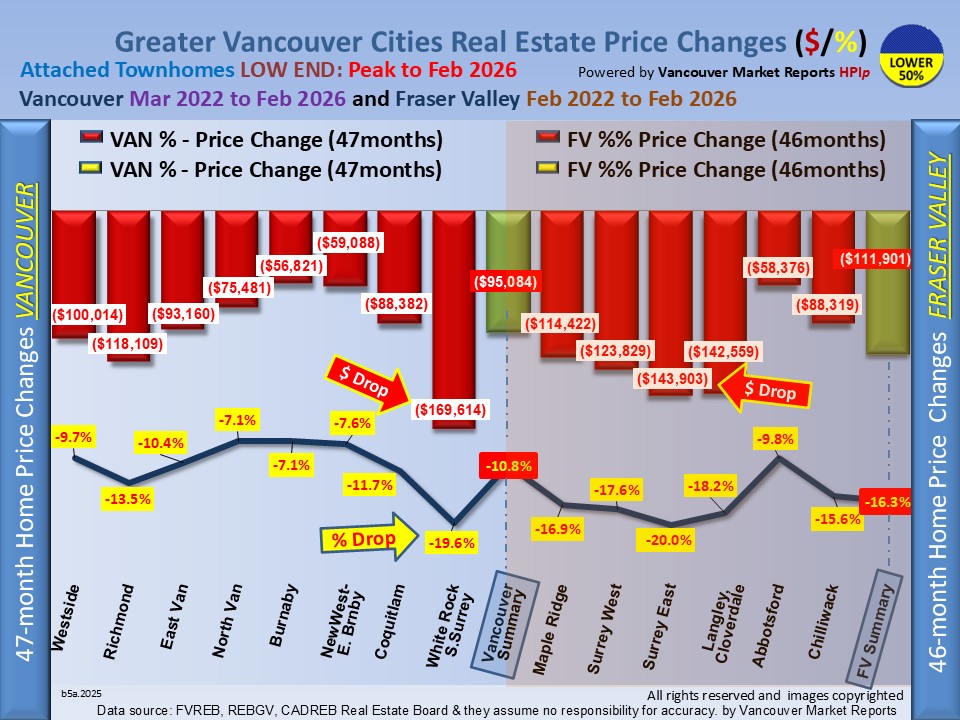
Condo prices also declined, dropping by an average of $4,457. About half of all condo markets continue to trend downward. Townhomes prices fell by an average of $4,492, with 56% of townhome markets also seeing declines.
The forecast for June is that detached homes and condos may continue to face downward pressure, while townhome prices could remain more stable. We all wait for the effect of the $2.5 billion bailout for unsold new condos in the Vancouver area.
It’s more important than ever to know what’s happening in your local area. Want to see how your neighborhood is performing? Check VancouverMarketReports.com every Saturday at noon for the latest Sell-Through Rates across all 17 cities. For expert advice or a free home market review, call Bill Coughlin and the Coughlin Team at 778-374-3744. We’re here to help you make the best move.
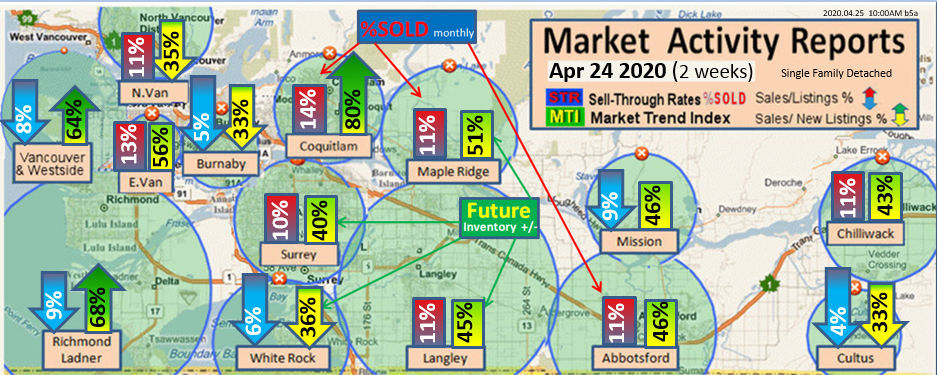
.Fraser Valley & Chilliwack July 10, 2026 (2-week update)
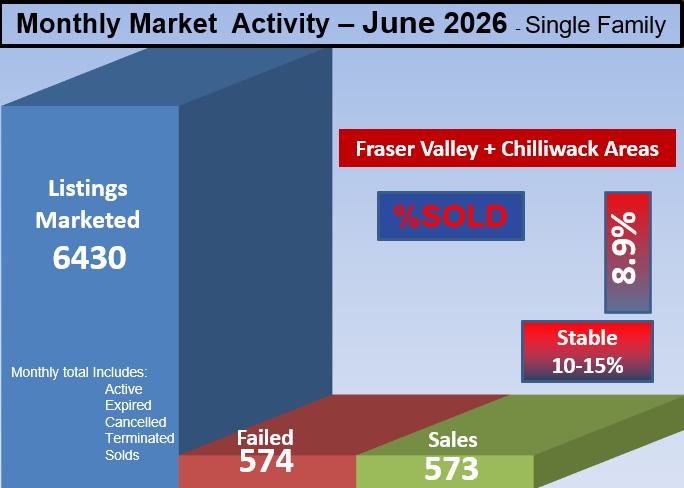
Current: Fraser Valley and the Chilliwack areas in Stable Market averaging a 9.8%SOLD rate. See each city link for the full details
Forecast:
The Fraser Valley housing market continued its slow pace in June. Detached home prices fell by an average of $5,640. Even though the average drop was smaller than in May, 61% of detached home markets are still seeing price reductions.
Condo prices also dropped, falling by an average of $6,893. Nearly 90% of condo markets are still seeing lower prices, making condos the weakest part of the market this month. Townhomes were the bright spot, with prices rising by an average of $1,992. In fact, 67% of townhome markets saw prices increase.
The outlook for June suggests that detached homes and condos may continue to face lower prices, while townhomes could stay more stable if buyer demand continues. We all wait for the effect of the $2.5 billion bailout for unsold new condos in the Vancouver area.
It’s more important than ever to know what’s happening in your local area. Want to see how your neighborhood is performing? Check VancouverMarketReports.com every Saturday at noon for the latest Sell-Through Rates across all 17 cities. For expert advice or a free home market review, call Bill Coughlin and the Coughlin Team at 778-374-3744. We’re here to help you make the best move.
|


.jpg)