|
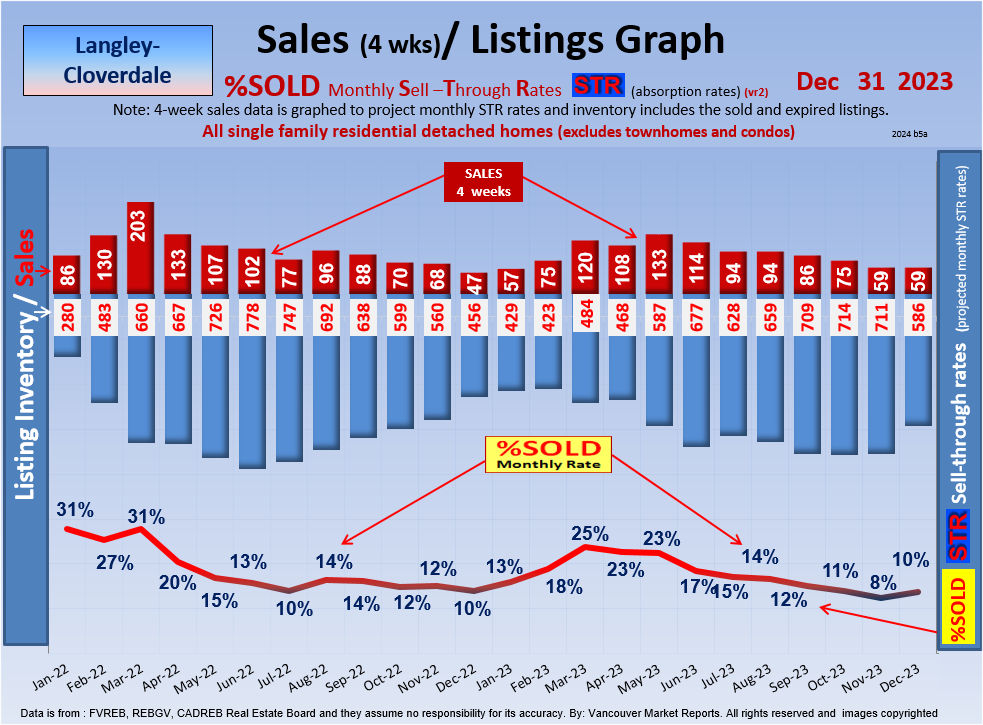
Current: Langley, Cloverdale is in a Stable Market with average listing inventories, 11 %SOLD rate and a 96% Sell/List Ratio.
(This means that there is an average of a $49,900 decrease on a sale from the original list price )
Most Active Range: Homes below $1.55 mill. - $1.7 mill. have High 22.1 %SOLD rate and is in a Seller Market
Least Active Range: Homes between $1.55 mill. - $1.7 mill. have 6.9 %SOLD rate.
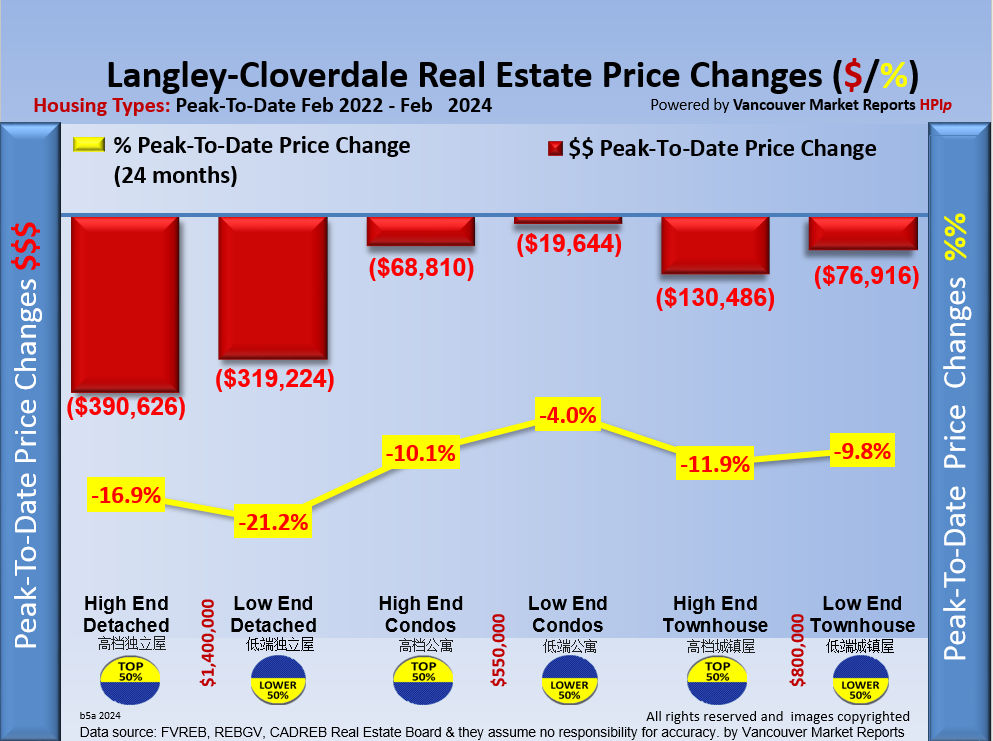
History: The Langley, Cloverdale Year-To-Date Home Price Index HPIp (Top 50%) shows that prices decreased $133,000.
The Langley, Cloverdale Year-To-Date Home Price Index HPIp (Lower 50%) shows that prices decreased $124,766.
*The HPIp (Home Price Index) is an approximate reflection of the Average Home Price Changes
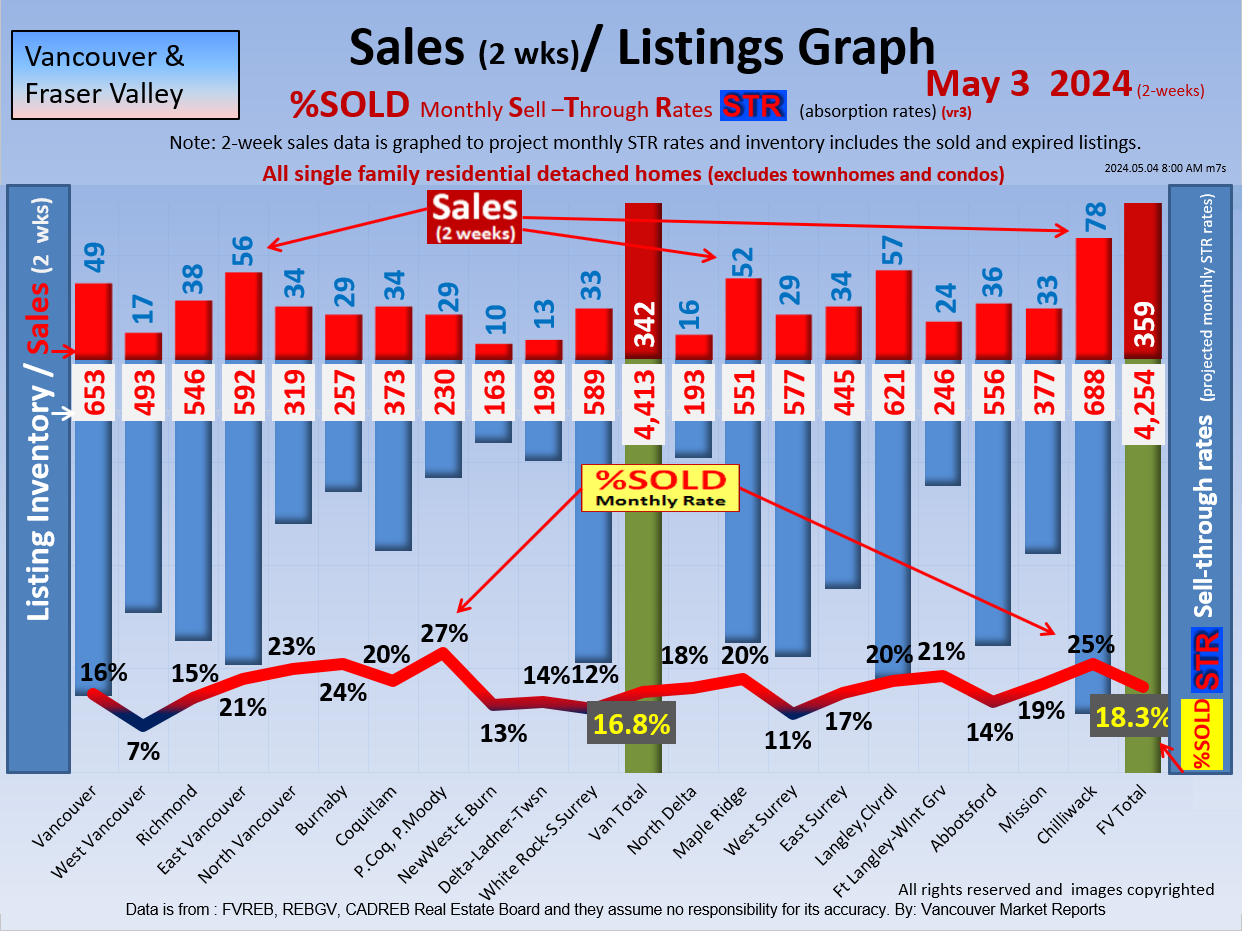
Forecast: Langley, Cloverdale has an average Listing supply; 621 homes are for sale and with the 11 %SOLD monthly rate gives us a 9 months of inventory. 15% of the active listings have reduced their price by $73,836 on average or $50,000 on average or $50,000 median in the last month. We project Langley, Cloverdale Detached to be a Stable market.
Greater Vancouver February 2026:
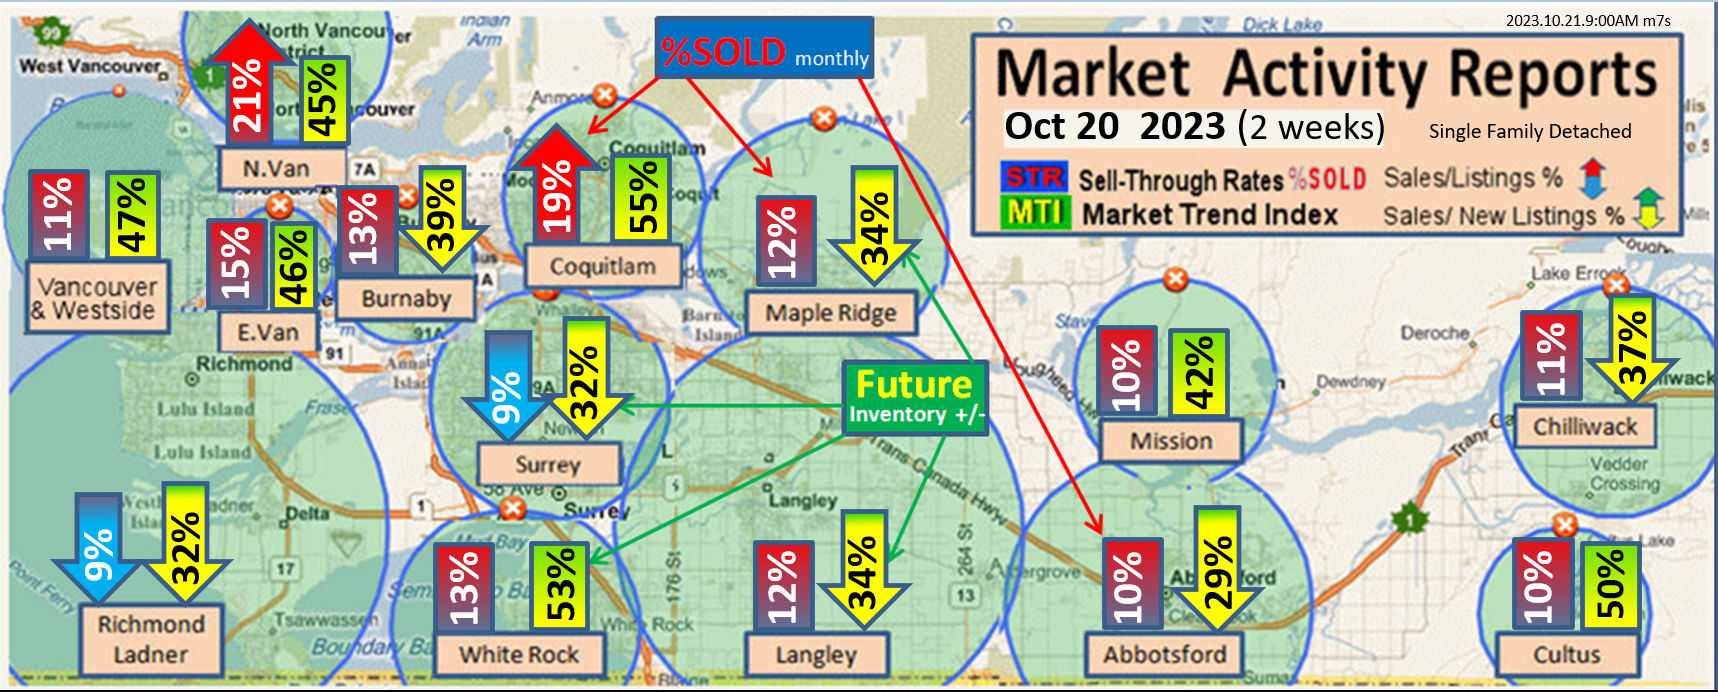
The housing market in Metro Vancouver is still a Buyer’s Market, but things are starting to slow down and stabilize. Detached home prices went down by an average of -$9,716 in February. This is better than January, when prices dropped -by $13,479. Prices are still going down, but not as fast. Right now, 61% of detached markets are dropping in price.
The condo market is doing better. Prices only dropped $333, which is much smaller than last month’s drop of $1,375. About 44% of condo markets are now going up, which is a good sign. Townhomes are mixed. Prices dropped -$5,563, which is a bit more than last month. But more areas are improving, with 38% of townhome markets going up, compared to 31% in January.
Overall, the market is starting to feel more balanced. There are still many homes for sale, so buyers have more choices. But prices are not falling as quickly. If this continues, prices may level out in the next 1 to 2 months, with condos and townhomes improving first.
Wondering which neighbourhoods are gaining momentum—or slowing? Visit VancouverMarketReports.com every Saturday at noon for the latest Sell-Through-Rates showing the Winners and Losers across all 17 cities. 📞 For expert guidance or a free Home Market Analysis, call Bill Coughlin and the Coughlin Team at 778-374-3744—we’re here to help you make the right move.
Fraser Valley February 2026:
The housing market in the Fraser Valley is starting to improve faster than Metro Vancouver. Detached home prices dropped -$1,027 in February, which is better than January’s drop of -$4,837. Also, 44% of detached markets are now going up, which shows growing strength.
The condo market is getting stronger. Prices dropped just-$2,356, but many more areas are improving. Now, 42% of condo markets are going up, compared to only 25% last month. Townhomes are weaker this month. Prices dropped -$2,938, and only 16% of markets are going up, which is lower than last month. This means this part of the market is still struggling.
Overall, the Fraser Valley market is moving toward a better balance. Buyers still have the advantage, but more areas are starting to improve. If this trend continues, the market could stabilize soon, especially as we move into the spring season.
Wondering which neighbourhoods are gaining momentum—or slowing? Visit VancouverMarketReports.com every Saturday at noon for the latest Sell-Through-Rates showing the Winners and Losers across all 17 cities. 📞 For expert guidance or a free Home Market Analysis, call Bill Coughlin and the Coughlin Team at 778-374-3744—we’re here to help you make the right move.
|