|
Vancouver Area June 27, 2025 (2-week update)
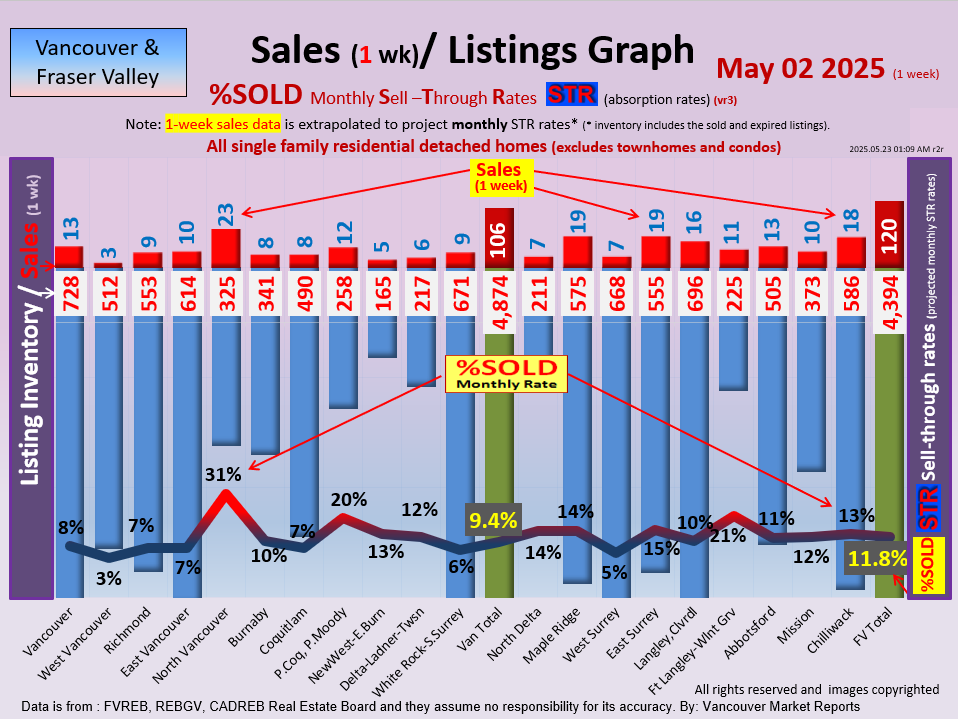
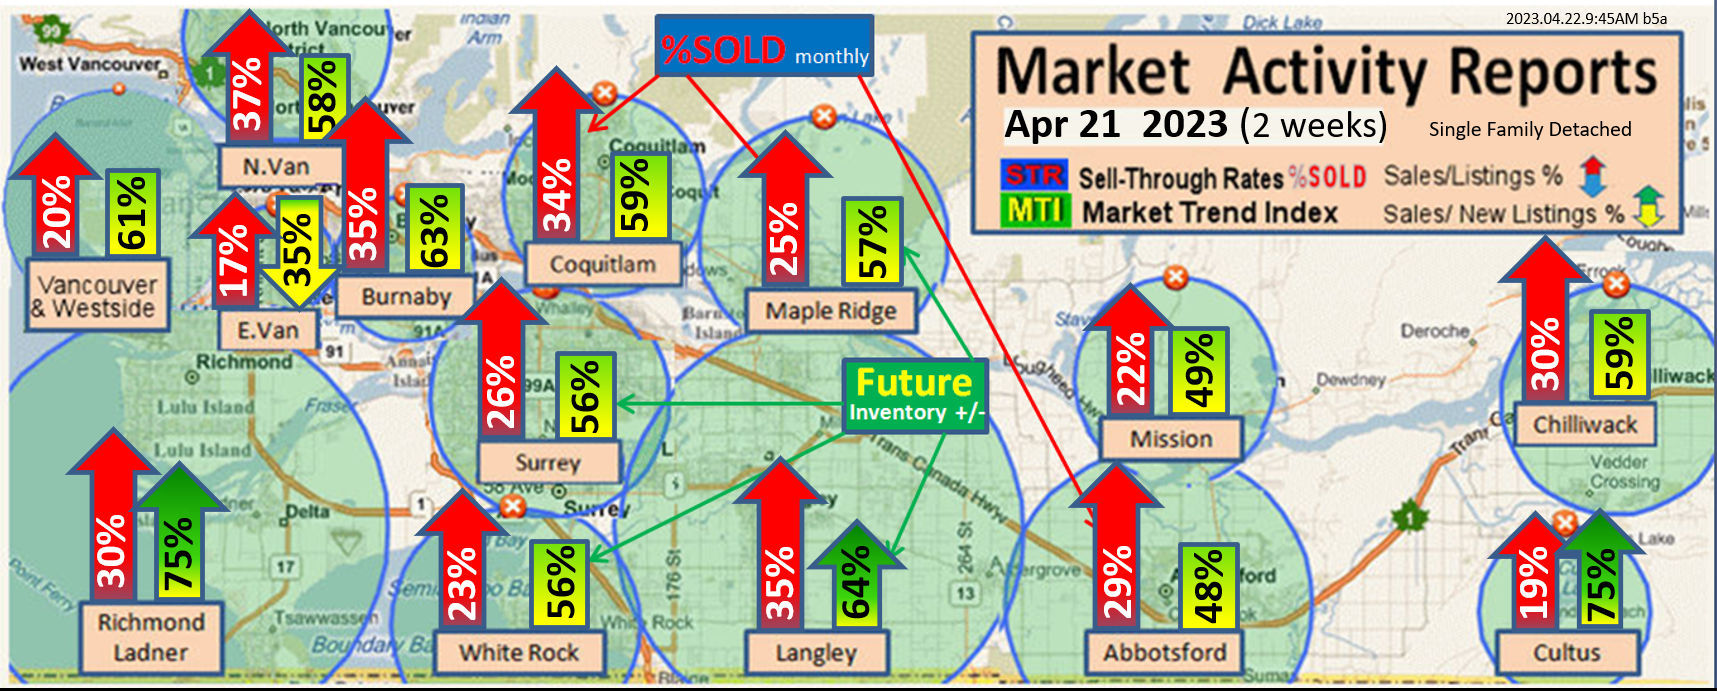
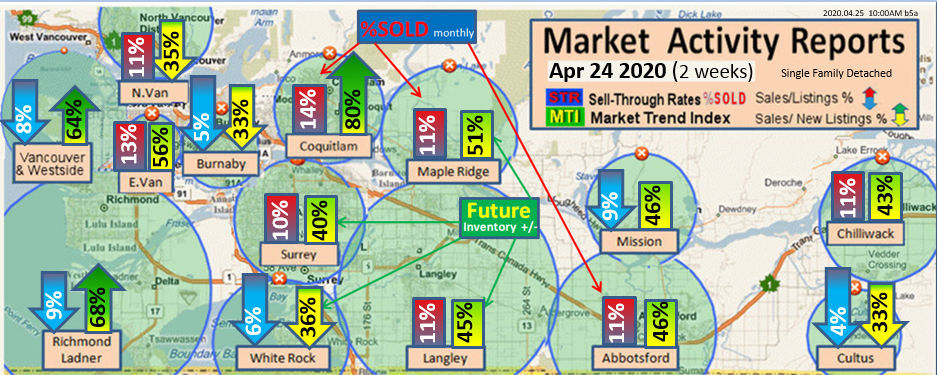
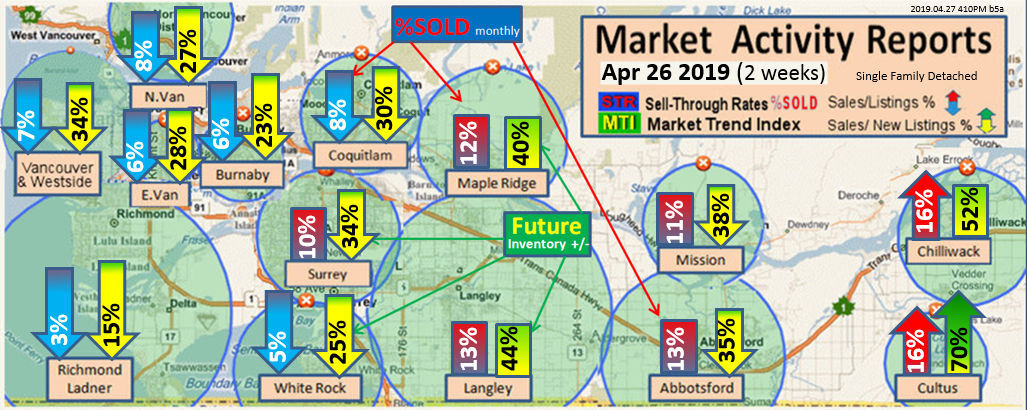
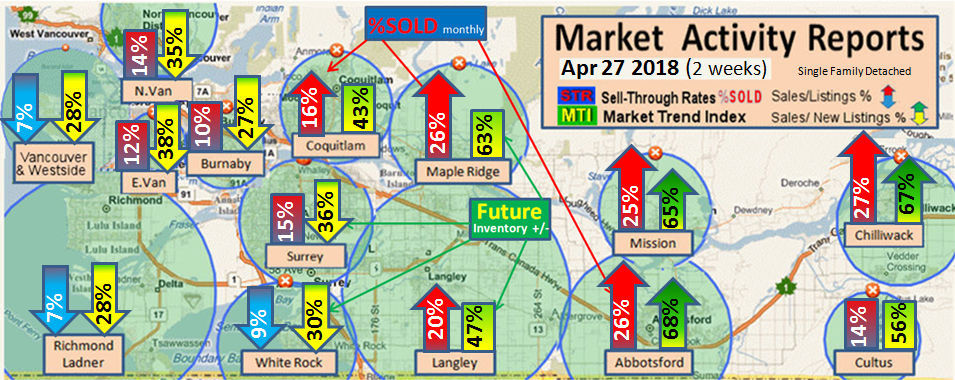
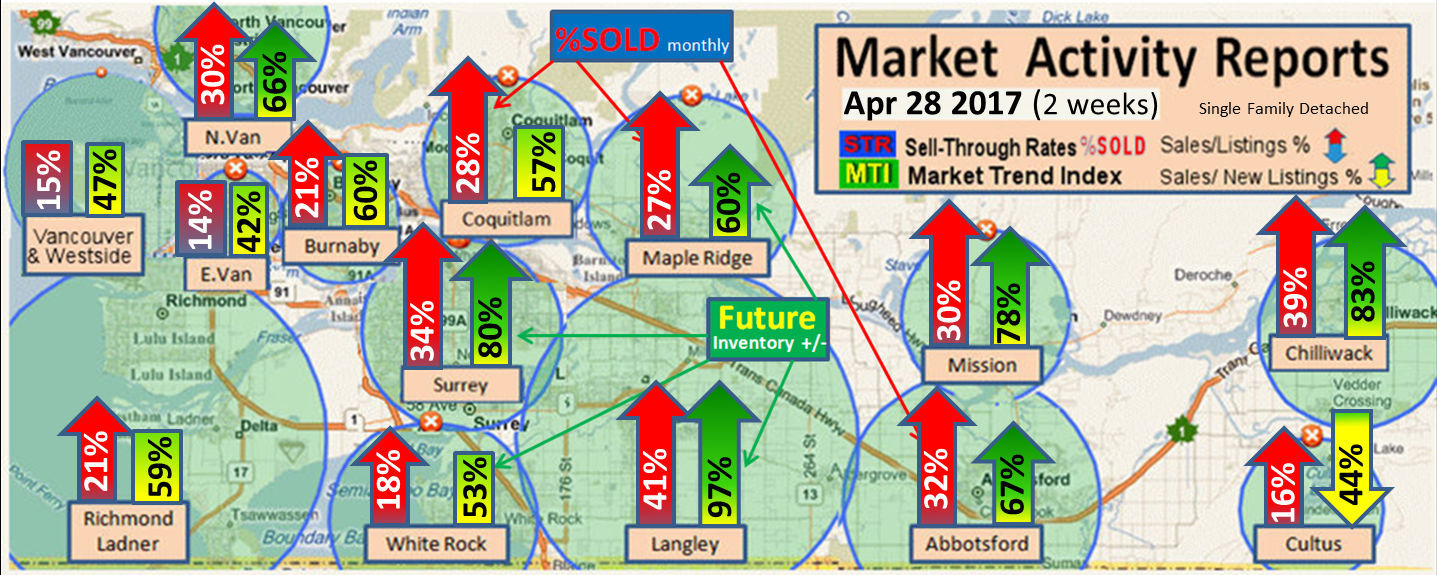
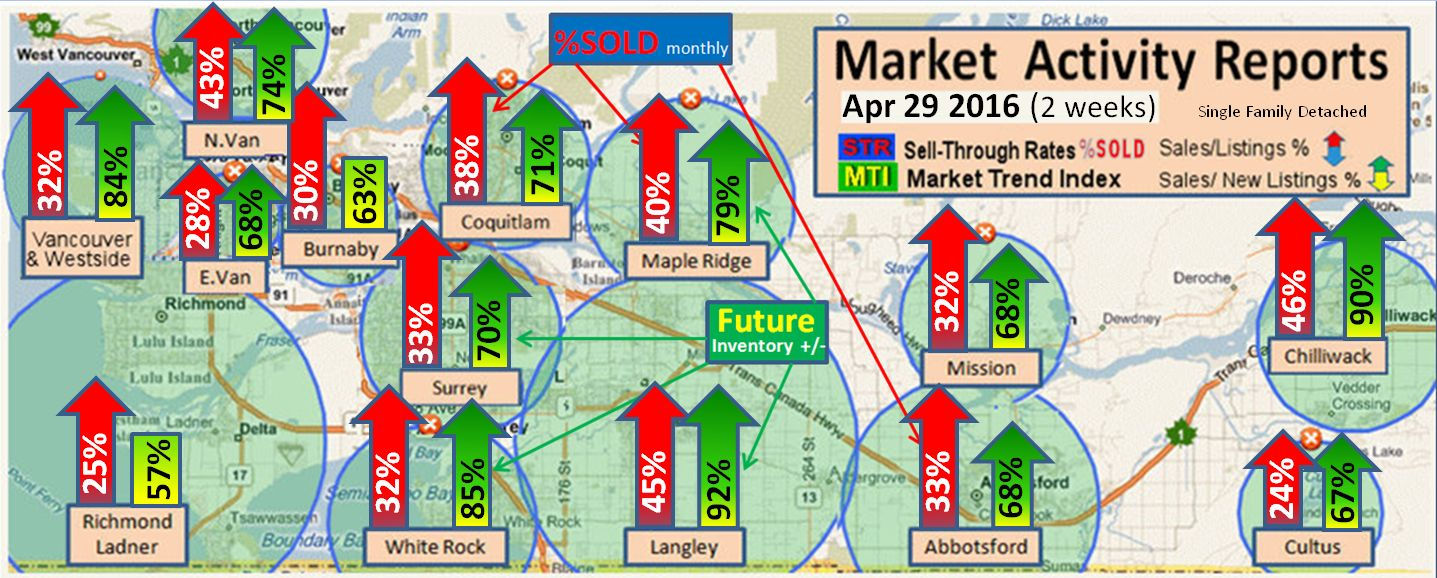
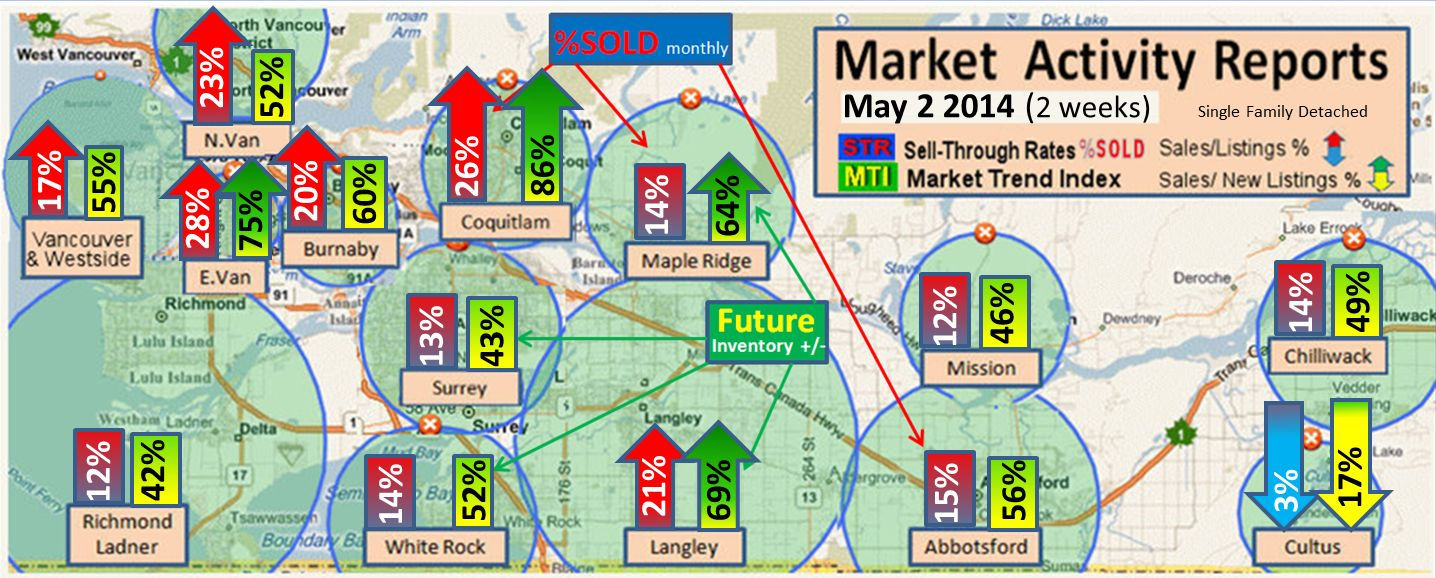
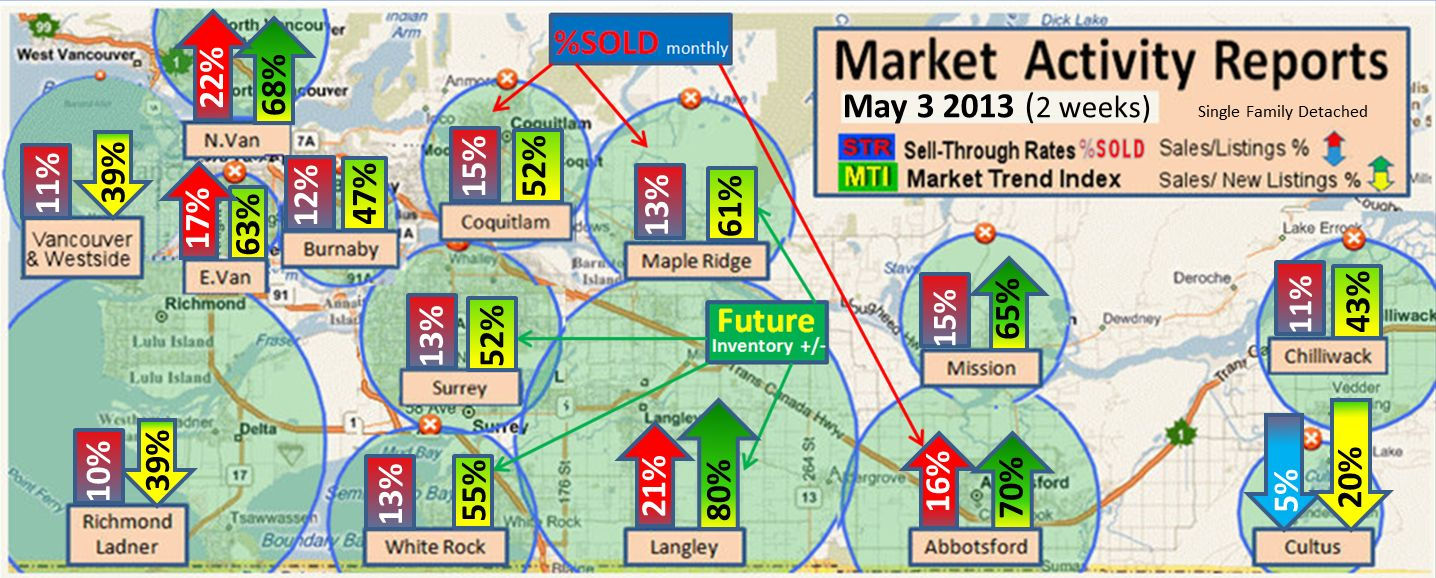
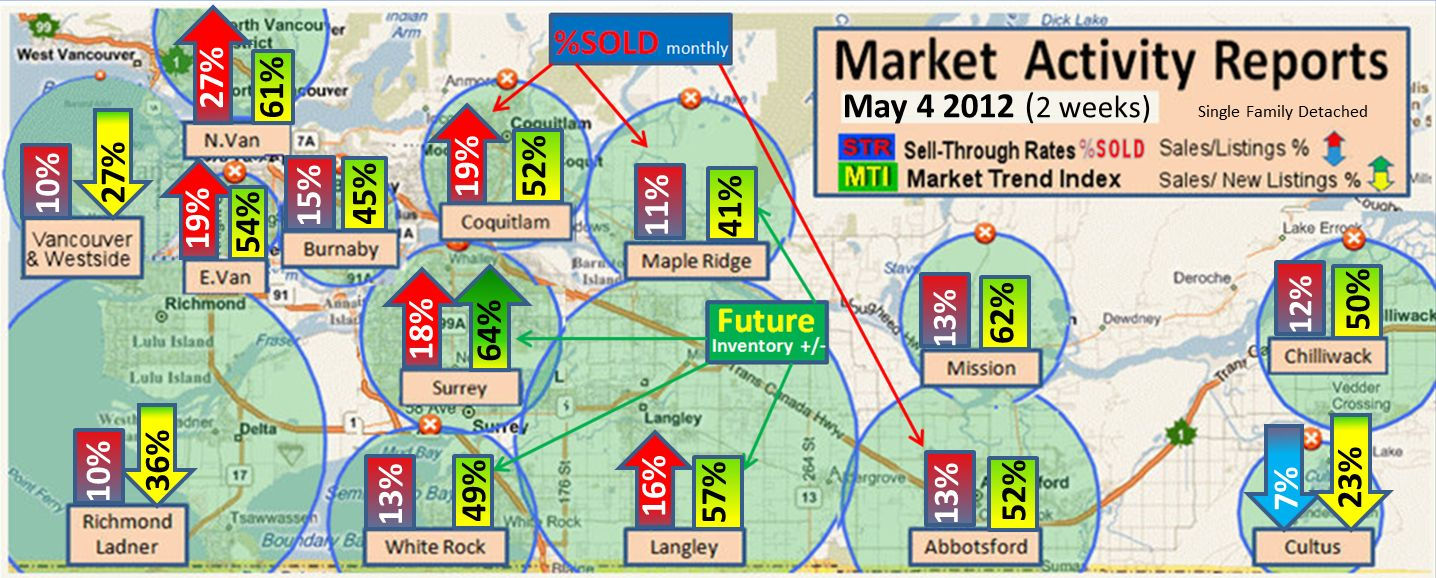
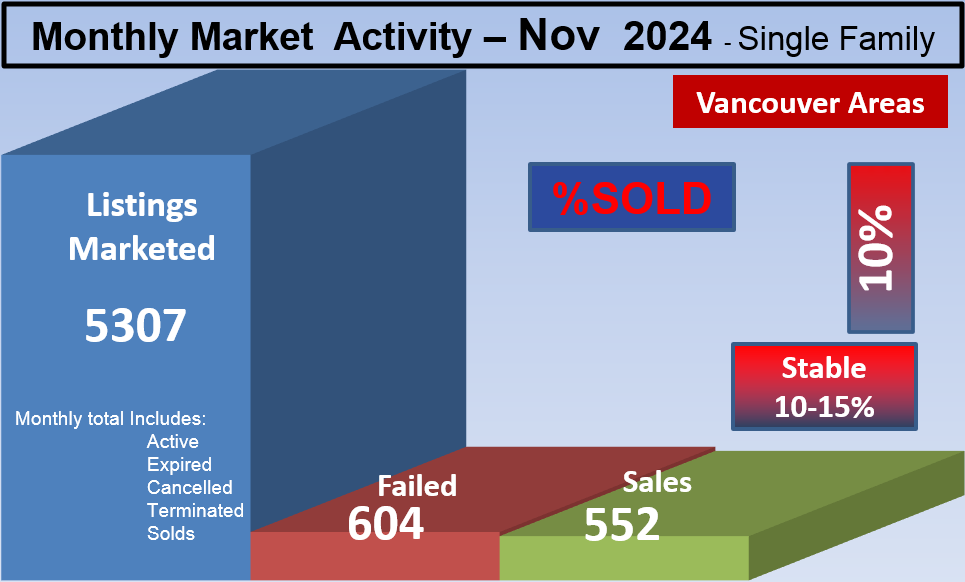
Current: Vancouver area Real Estate Market is in Buyer's Market with an average of 21 %SOLD rate. See each city for the full details.
Forecast: Greater Vancouver March 2025:
March Brings a Spark of Life to a Very Slow Market!
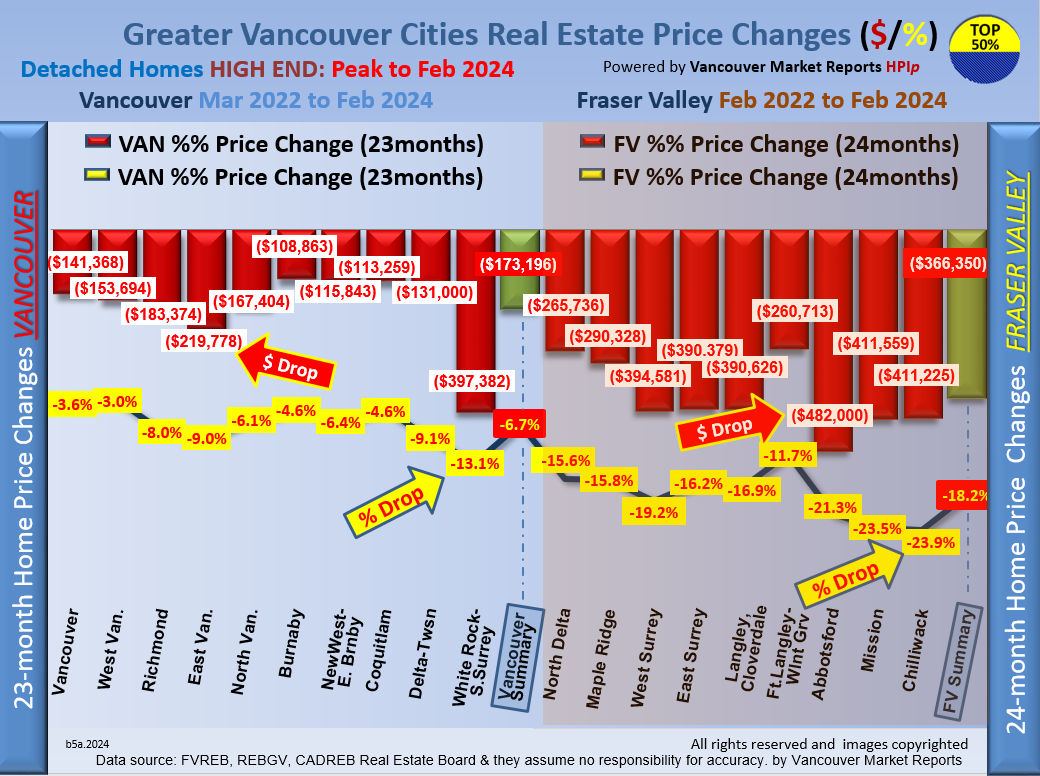
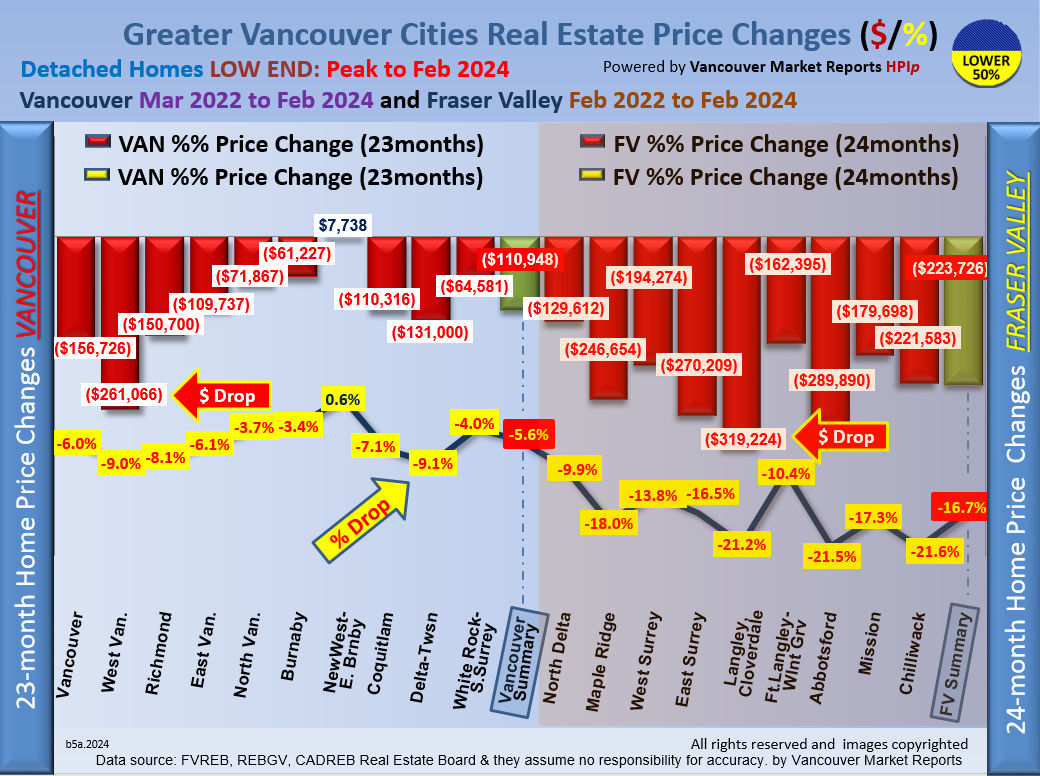
In March, 52% of single-family homes climbed in value. The average price rose by $1,506, a solid shift after that $4,022 drop we saw in February.
But watch out—the election fog is here. We forecast that many buyers and sellers will hit pause until it's over. That means we will slide into a buyer’s market across Metro Vancouver.
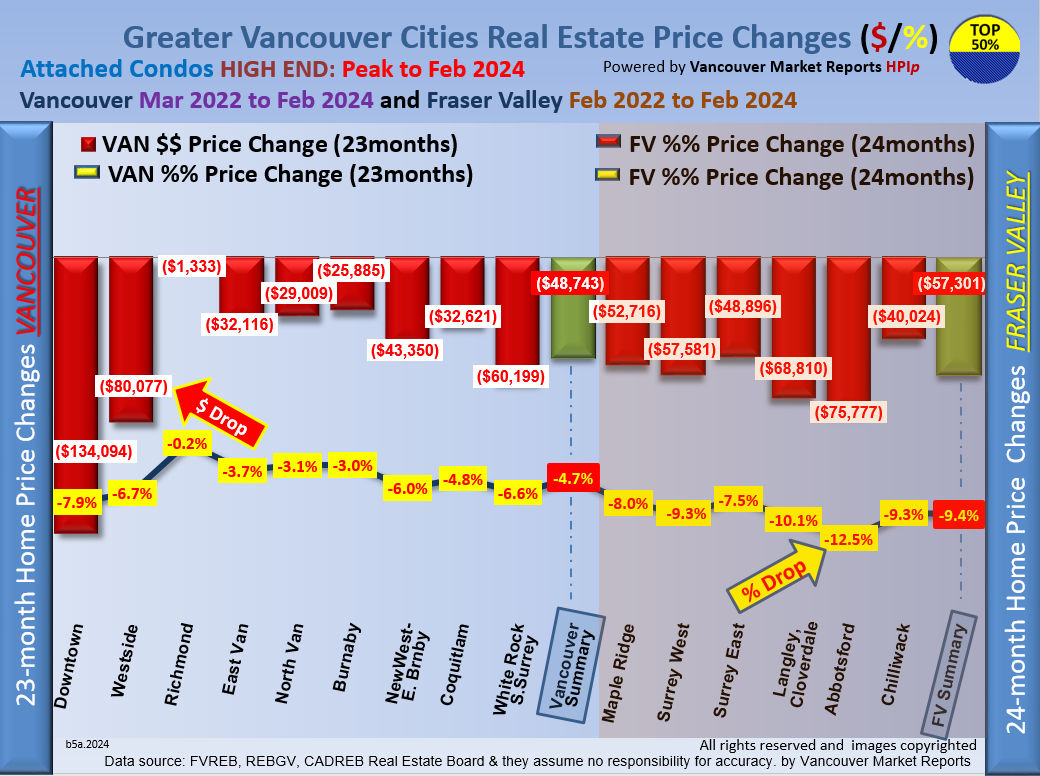
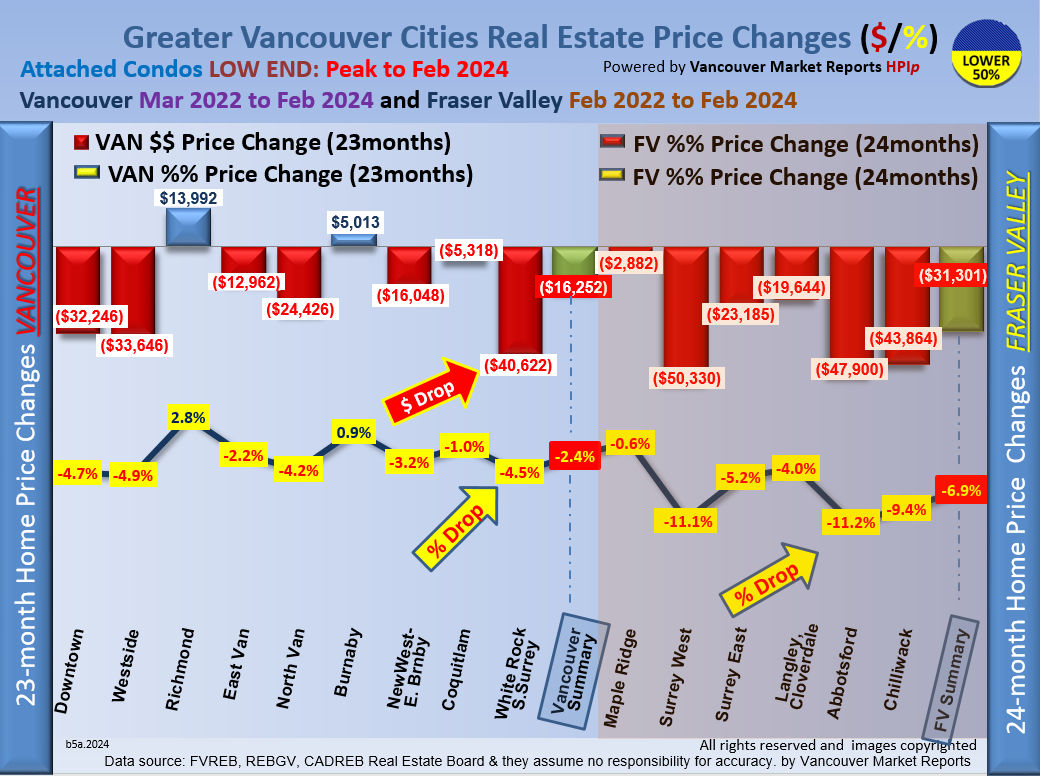
Condos? Our most affordable market saw a whopping 72% increase, with values climbing $3,320 on average. Townhouses didn’t get the same boost—the average price still dipped by $2,218. We forecast that condos and townhomes will level off or keep tipping in the buyer’s favour as we move through the election and the Trump Tariffs.
Want to know which markets are heating up—or cooling down? Check VancouverMarketReports.com every Saturday at noon to see the weekly changes. 📞 Need expert advice or a free Home Market Analysis? Call Bill Coughlin and the Coughlin Team at 778-374-3744. Let’s help you make the right move.
Fraser Valley March 2025:
March Brings a Spark of Life to a Very Slow Fraser Valley Market!
In March, 61% of detached homes went up in value. On average, single-family homes increased by $1,066, which is a nice change after the $5,136 drop in February.
But watch out—the election fog is here. We forecast that many buyers and sellers will hit pause until it's over. That means we will slide into a buyer’s market across Metro Vancouver.
Condos? Our most affordable market saw a 67% of them went up in price, with an average increase of $1,483. Townhouses didn’t get the same boost—the average price still dropped by $1,486. We forecast that condos and townhomes will level off or keep tipping in the buyer’s favour as we move through the election and the Trump Tariffs.
Want to know which markets are heating up—or cooling down? Check VancouverMarketReports.com every Saturday at noon to see the weekly changes. 📞 Need expert advice or a free Home Market Analysis? Call Bill Coughlin and the Coughlin Team at 778-374-3744. Let’s help you make the right move.
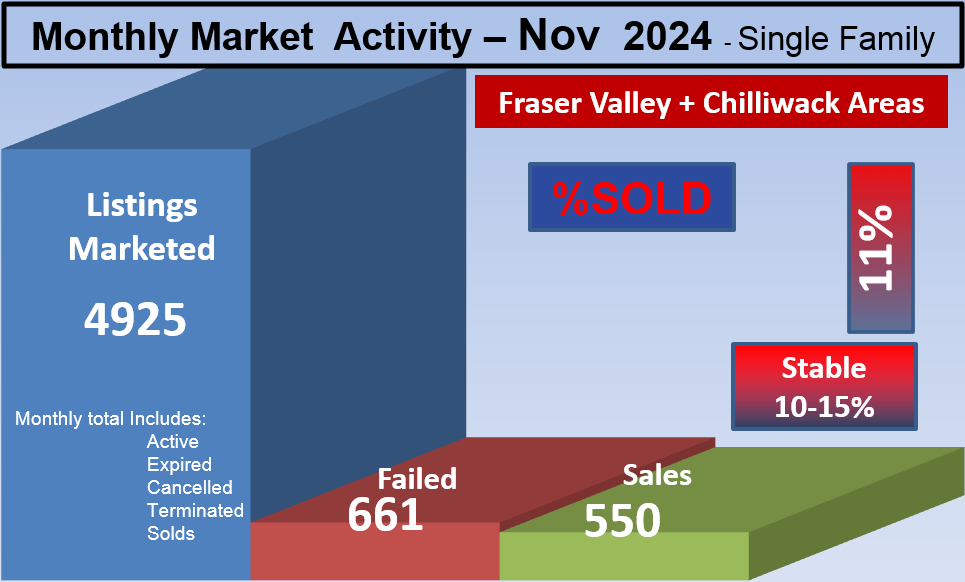
Fraser Valley & Chilliwack June 13, 2025 (2-week update)
Current: Fraser Valley and the Chilliwack areas are in a Stable Market averaging a 14.1% SOLD rate. See each city link for the full details
|


.jpg)