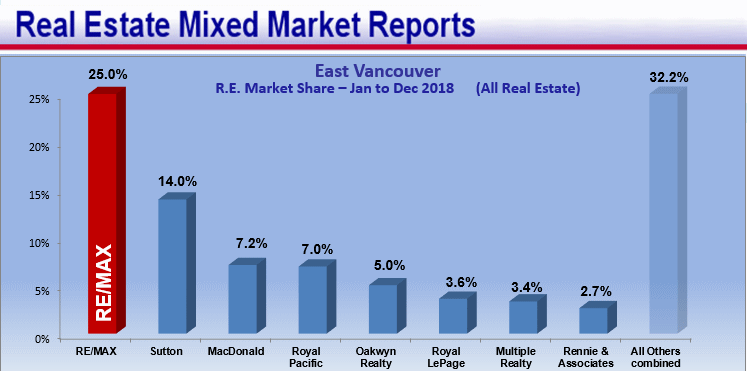
Sponsored in part by Virtual Real Estate Assistants​

East Vancouver Vancouver Market Reports Market Update 

Hi , your free Vancouver Market Reports Plus many Advanced Market Reports.

Question? Do you know when 's market will switch to a Buyers Market, in advance?

Bottom-line if you are not using our Advanced Market Reports you have lost 25% of your profits.

Our Advanced Reports and the Stats Boot Camp Course empower Agents to get shaper prices;higher sell-through rates and to be able to show their clients the actual market trends.

Many of these Advanced Reports will probably look like gibberish until you take a lesson. Once empowered with your own personalized reports, then you can really understand the market trends to protect your clients and make you more money.    Standing by to help you :)  Bill Coughlin  778-374-3744  eXp Realty  


Now even Condominiums eked small gains in most communities this year!

Would like to to see the Condos Low & the Townhouse Changes too?   Note: All of these Home Price Changes are complied from the most accurate VMR Home Price Index (paired) HPIp

, if you do not want any future RE/MAX Market Reports  Please reply Remove Me and you will be sorely missed! :) Bill Coughlin

......

East Vancouver

Sep 1, 2023

gas gauge

 Current: East Vancouver has a Seller Market with average listing inventory, 14 %SOLD rate, a  99% Sell/List Ratio and 13 DOM.
                      (This means an average of a $23,000 increase on a sale from the original list price)          

             Most Active Range: Homes below $1.7 mill.-$1.9 mill. have High 28.2 %SOLD rate.        
             Least Active Range: Homes between $2.5 mill. -$2.9 mill. have 6.2 %SOLD rate.

 History: The East Vancouver Year-To-Date Home Price Index HPIp (Top 50%) shows that prices increased $9,380.
                The East Vancouver Year-To-Date Home Price Index HPIp (Lower 50%) shows that prices increased $120,407.
                           *The HPIp (Home Price Index) is an approximate reflection of the Average Home Price Changes.

 Forecast: East Vancouver has average Listing Supply; with 425 homes for sale and the  16 %SOLD monthly rate gives us ~7 months of Inventory. 9% of the active listings have reduced their price by $139,677 on average or $113,500 on median for the last month. We project East Vancouver to be a continued Seller Market.
 

Greater Vancouver August 2023:

In Greater Vancouver, the average prices of single-family detached homes took a dramatic turn in August, dropping by $8,319, a sharp contrast to the previous month's $2,661 increase. This marks the first decline since January. Our analysis suggests a shift toward a more stable real estate market. In this changing landscape with low inventory and the highest interest rates in 21 years, staying informed is crucial for buyers, sellers, and investors. Explore detailed reports for specific cities in Greater Vancouver through the city menu for a deeper understanding.

Currently, both the condominium and townhouse markets are in a state of stability. Condos have seen their average prices decrease by $3,572, while townhouses have faced a drop of $5,795.

Every Saturday at noon, we analyze 97 different city House Price Indices and present the most accurate market trends to you at VancouverMarketReports.com. Please get in touch with us if you'd like a market value update that includes a thorough analysis and forecast for your neighborhood and local market area. - Your Neighborhood.

Fraser Valley August 2023:

In the Fraser Valley, the average prices of single-family detached homes took a significant turn in August, dropping by $9,319, a sharp contrast to the previous month's modest $318 increase. This marks the first decline since February. Our analysis suggests a shift toward a more stable real estate market. In this changing landscape, with low inventory and rising interest rates, staying informed is crucial for buyers, sellers, and industry participants. Explore detailed reports for specific cities in Greater Vancouver through the city menu for a deeper understanding.

Currently, both the condominium and townhouse markets are in a state of stability. Condos have seen their average prices decrease by only $68, while townhouses have faced a drop of $2,071.

Every Saturday at noon, we analyze 97 different cities' House Price Indices and present the MOST ACCURATE Market Trends to you at VancouverMarketReports.com. Please get in touch with us if you'd like a market value update that includes a thorough analysis and forecast for your neighborhood and local market area. - Your Neighborhood.


Sponsored in part by Virtual Real Estate Assistants​


Since 1984 RE/MAX Agents have had an edge; their monthly RE/MAX Market Reports .. It has being my privilege to expand these reports into critical marketing tools. Thank You!  Bill Coughlin

My passion to help..... I seriously dream of new marketing tools to enable you make more money! 

OK the Advanced Market Reports are tooo complicated at first glance. These reports are now split  into

  • the Quick Reports for easy review
  • the Advanced reports that really needs a Stats Boot Camp lesson to fully comprehend
  • Forecasting for the Stats addicts like me.

Announcing the Instant Home Price Evaluator.  In the year 2012, 82% of listings from Burnaby to Chilliwack DID NOT SELL,  or were Discounted on sale an Amazing 7.8%* from the original list price!  Help to price it right has arrived! 18 % homes were listed at a salable price and sold within 3.7%* .

Our Instant Home Price Evaluator  on the right side takes just seconds and has an accuracy before adjustment of ~3.7%* of the resulting sale price 31% of the time.   * (on average)    
do call us for your custom reports and Stats Lessons  Bill Coughlin 778-374-3744

Spring 2014 Market News

 STOP  61% of 's listings from EXPIRING!


 RE/MAX Market Share Reports (Jim Lees revamped)

Sponsored in part by Virtual Real Estate Assistants​

Hello  , fellow RE/MAX Agent.
These Re/MAX Market Share Reports are sponsored by
the Canada's Most Referred Referral Network! we thank  them for their support and please refer to them in your appreciation.

West Van - Steve Burk North Van - steve Burk Downtown Westend - Steve Burk Van Westside - Sharon Lum Coquiltam - Phil Haig Port Coquiltam and Port Moody -Phil Haig Mission - Bill Coughlin Chilliwack - Corney Les Cultus Lake - Bill Coughlin Abbotsford - Bill Coughlin North Langley - Jorda Langley - Bill Coughlin East Surrey - Greg Mark West Surrey - Greg Mark Burnaby - Albert Yen New West - John Mackenzie North Delta - Tom Edwards White Rock - Team Claude Richmond Multi Family - Larry and Taylor Biggar Richmond - Larry and Taylor Biggar Coal Harbour - Steve Burk N. Burr..by - Charlie Kiers Maple Ridge - Lori Blake Ladner Delta - Gurdial Badh East Van Multi Fmly - Gurdial Badh East Van -Charile Kiers Powell River - Ross Cooper Whistler Edmonton - John Carle Calgary - 1 Calgary - 2 Calgary - 3 Kelowna Edmonton - Jogn Carle 2 Calgary - 4 Calgary - 5 Calgary - 6 Calgary - 7 Calgary - 8 Calgary - 9 Calgary - 10 Calgary - 11 Calgary - 12 Calgary - 13 Nanaimo - Rudi Widdershoven Victoria RMR Referral Network The Network is growing and growing !

2015 Cumulative Report       2014 Cumulative Report

NOTE: This representation is based in whole or in part on data generated by the Real Estate Boards of Greater Vancouver, Fraser Valley, Chilliwack which assume no responsibility for its accuracy.   

East Vancouver Real Estate reports include sub areas such as Collingwood Van East, Killarney VE, Renfrew VE, South Vancouver, Knight etc. Contact Bill as the Local Expert more details.

East Vancouver reports which includes sub areas such as Collingwood Van East, Killarney VE, Renfrew VE, South Vancouver, Knight etc.

East Vancouver reports which includes sub areas such as Collingwood Van East, Killarney VE, Renfrew VE, South Vancouver, Knight etc.

East Vancouver reports which includes sub areas such as Collingwood Van East, Killarney VE, Renfrew VE, South Vancouver, Knight etc.

East Vancouver reports which includes sub areas such as Collingwood Van East, Killarney VE, Renfrew VE, South Vancouver, Knight etc.

Download the East Vancouver market reports.PDF

South Vancouver, Collingwood Van East, Killarney VE, Renfrew VE, Knight etc. are included in East Vancouver reports

South Vancouver, Collingwood Van East, Killarney VE, Renfrew VE, Knight etc. are included in East Vancouver reports

South Vancouver, Collingwood Van East, Killarney VE, Renfrew VE, Knight etc. are included in East Vancouver reports

South Vancouver, Collingwood Van East, Killarney VE, Renfrew VE, Knight etc. are included in East Vancouver reports

East Vancouver reports which includes sub areas such as Collingwood Van East, Killarney VE, Renfrew VE, South Vancouver, Knight etc.

These East Vancouver Real Estate Market reports include sub areas such as Renfrew VE, Knight, Collingwood Van East, Killarney VE, South Vancouver etc.


About these Reports
 

  • Pop-bye Gifts
  • Gift Cards
 

Real Estate Mixed Market Reports


Real Estate Mixed Reports
Request


*Full Name:
          
*Real Estate Office:
          
*Email:
          
*City:


Number of visits on this page: 14,008. Number of visits on this site: 10,319,086.